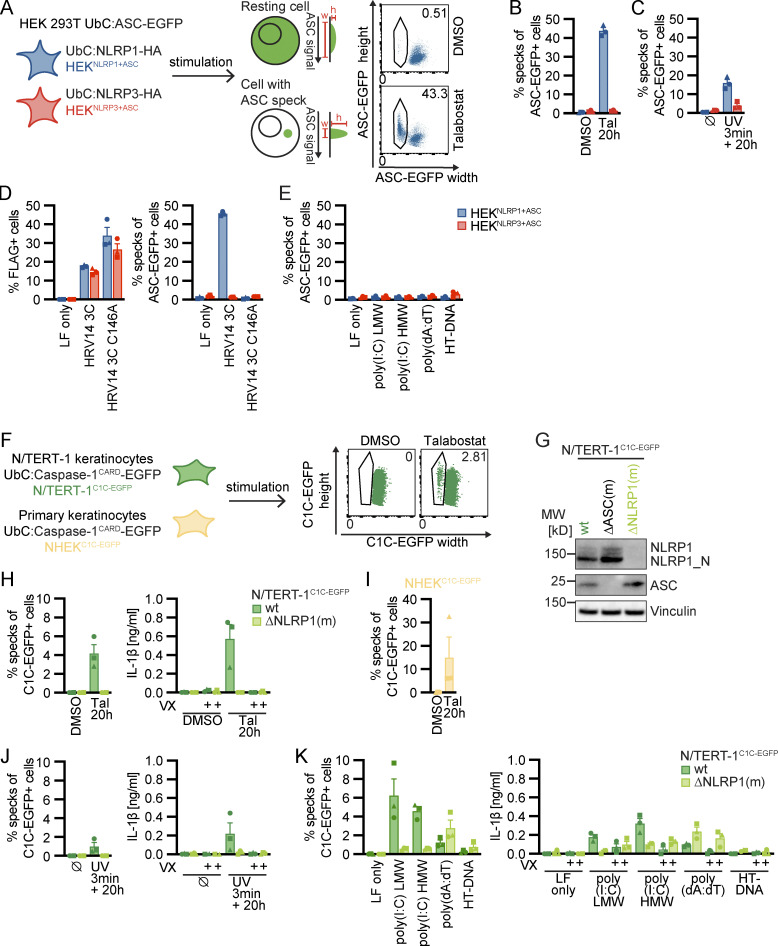
Figure 1.
Reporter cell lines recapitulate NLRP1 inflammasome assembly. (A) Scheme of generated HEK 293T reporter cell lines and detection of ASC specks by flow cytometry. (B–E) HEKNLRP1+ASC or HEKNLRP3+ASC cells were treated with 30 µM Tal (B) or UV for 3 min (C), or were transfected with expression vectors for FLAG-tagged HRV 14 protease 3C (D), or 1 µg/ml of the indicated nucleic acid species (E). 20 h after treatment, ASC-EGFP–positive cells were analyzed by flow cytometry and the fraction of cells with ASC specks was determined with the gating strategy described in A. In D, cells were additionally stained for FLAG and ASC specks were only quantified in FLAG-positive cells for all samples transfected with plasmids, i.e., not in LF only controls. (F) Scheme of generated N/TERT-1 reporter cell lines and detection of C1C specks by flow cytometry. (G) N/TERT-1C1C-EGFP cells and monoclonal ASC and NLRP1 knockout derivatives were analyzed by immunoblot with the indicated antibodies. (H–K) N/TERT-1C1C-EGFP cells and their monoclonal NLRP1 knockout derivatives (H, J, and K) or NHEKC1C-EGFP (I) were treated with the indicated stimuli for 20 h as described above. For flow cytometry experiments, cells were additionally treated with 100 µM VX. To quantify inflammasome assembly, C1C-EGFP–positive cells were analyzed by flow cytometry. The fraction of cells with C1C-EGFP specks was determined with the gating strategy described in F. IL-1β from the supernatants of cells stimulated in the absence or presence of 100 μM VX was quantified by HTRF (H, J, and K). Data represents average values (with individual data points) from three independent experiments ± SEM. UbC indicates ubiquitin C (promoter). MW, molecular weight. Source data are available for this figure: SourceData F1.

