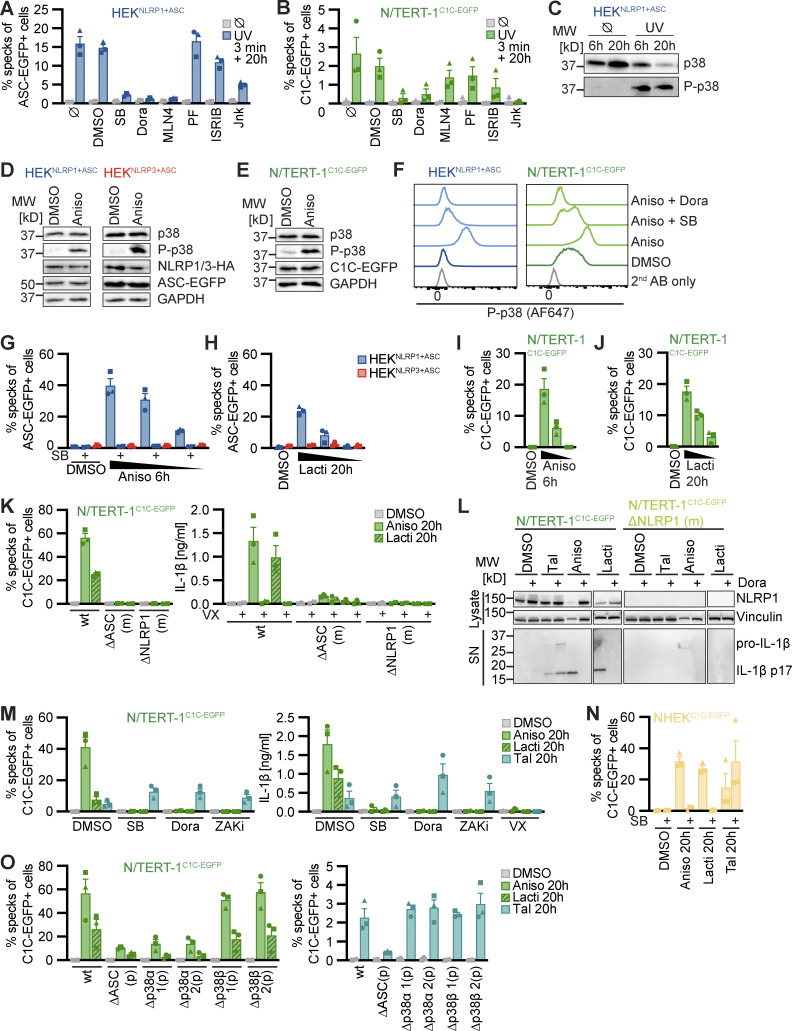
Figure 2.
Human NLRP1 is activated by the ribotoxic stress response. (A–C) HEKNLRP1+ASC (A and C) or N/TERT-1C1C-EGFP (B) cells were treated with UV for 3 min and cultivated for 20 h in the presence of 20 μM SB, 10 µM Dora, 1 μM MLN4, 1 μM PF, 200 nM ISRIB, 3 µM Jnk, or DMSO. ASC speck formation was quantified by flow cytometry as described in Fig. 1 (A and B), or lysates analyzed by immunoblot with antibodies for p38 and phospho-p38 (P-p38; C). (D–F) HEKNLRP1+ASC (D and F), HEKNLRP3+ASC (D), or N/TERT-1C1C-EGFP (E and F) were treated with DMSO or 15 µM Aniso for 60 min, where indicated in the presence of 20 µM SB or 10 µM Dora. Lysates were analyzed by immunoblot with antibodies for p38, P-p38, HA, EGFP, or GAPDH (D and E). Fixed cells were stained for P-p38 and analyzed by flow cytometry (F). (G–J) HEKNLRP1+ASC, HEKNLRP3+ASC (G and H) or N/TERT-1C1C-EGFP (I and J) cells were treated with DMSO, 15/1.5/0.15 µM Aniso for 6 h, or 2.5/0.5/0.1 µM Lacti for 20 h, where indicated in the presence of 20 µM SB. Specks were quantified as in A and B. (K–O) N/TERT-1C1C-EGFP cells (K, L, M, and O), their monoclonal NLRP1 or ASC knockout derivatives (K and L), their polyclonal p38α or p38β knockout derivatives (O), or NHEKC1C-EGFP (N) were treated with DMSO, 15 µM Aniso, 2 µM Lacti, or 30 µM Tal for 20 h, where indicated in the presence of 20 µM SB, 10 µM Dora, or 100 nM ZAKα inhibitor 6p (ZAKi). Specks were quantified as in A and B. IL-1β from the supernatants of cells stimulated in the absence or presence of 100 μM VX was quantified by HTRF (K and M). NLRP1 and Vinculin in the lysates, as well as IL-1β in precipitated supernatants were analyzed by immunoblot (L). The immunblot data from the complete experiment with additional samples and antibodies is shown in Fig. S4. N/TERT-1C1C-EGFP and NHEKC1C-EGFP cells were stimulated in the presence of 100 µM VX for all flow cytometry experiments. Data from all experiments quantifying specks or IL-1β release represents average values (with individual data points) from three independent experiments ± SEM. Immunoblots in C–E and L, as well as flow cytometry data in F display results representative of two (L) or three (C–F) independent experiments. MW, molecular weight. Source data are available for this figure: SourceData F2.

