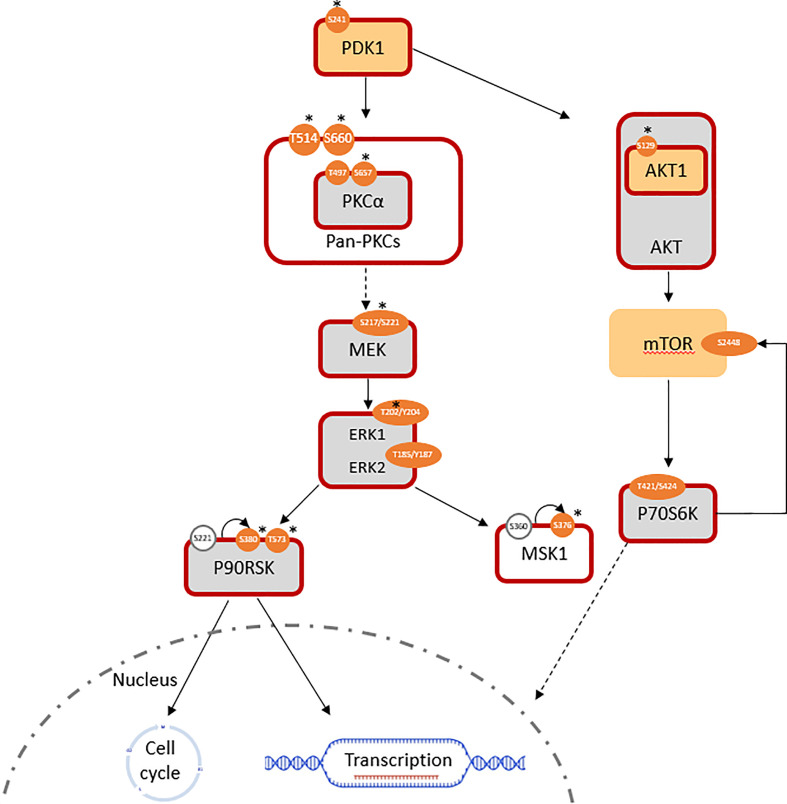
Figure 1.
Pathways involved in the induced trastuzumab resistance of T15 (log2 FC normalized to SKBR3 signals). Similarly expressed protein: light grey; antibody not available/poor performance: no fill; overexpressed total protein ≥ 1.5-fold (log2 FC ≥ 0.58): light orange; ≥ 2-fold: *; over-represented phosphosite ≥ 1.5-fold: orange; ≥ 2-fold: *; predicted active protein: dark red outline.

