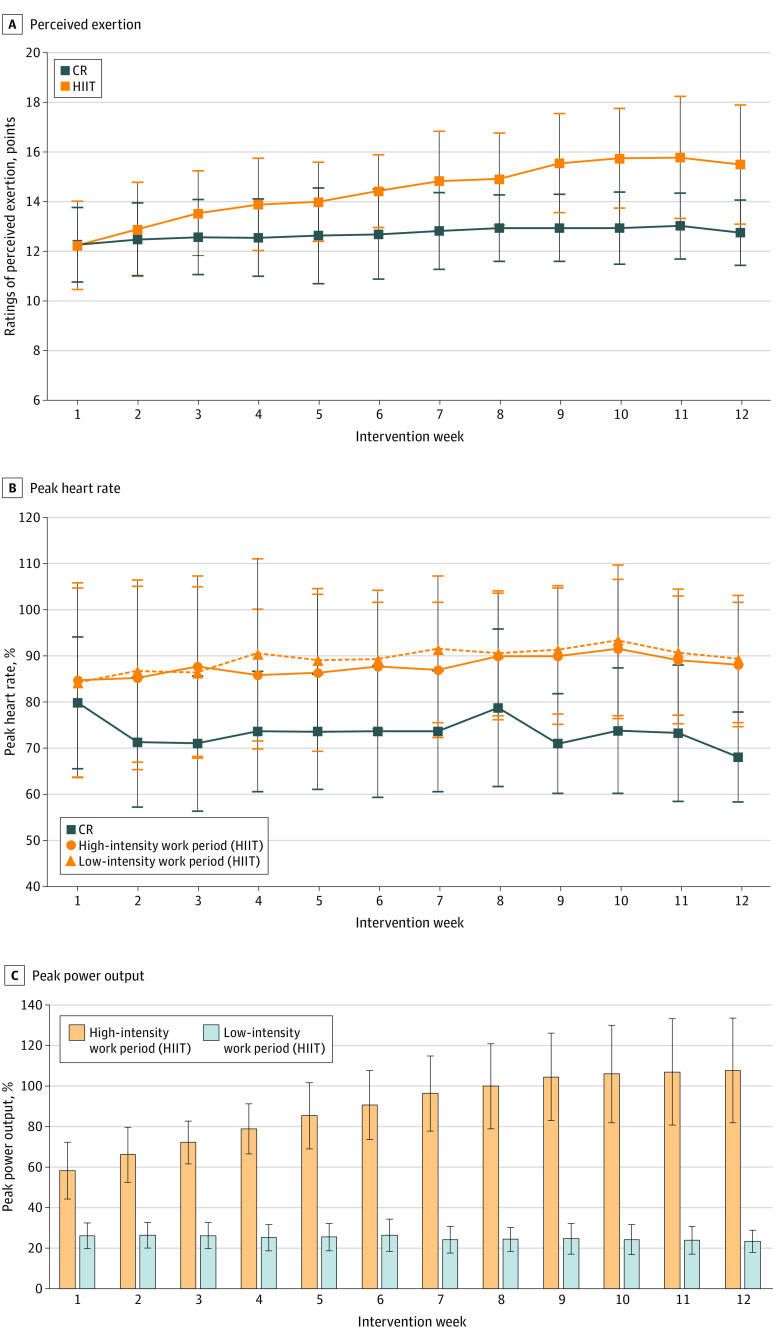
Figure 2. Exercise Training Responses.
The exercise training responses including (A) ratings of perceived exertion, (B) percentage of peak heart rate, and (C) percentage of peak power output throughout the high-intensity interval training (HIIT) and cardiovascular rehabilitation (CR) groups from intervention week 1 to 12. Values are plotted as means (SDs).

