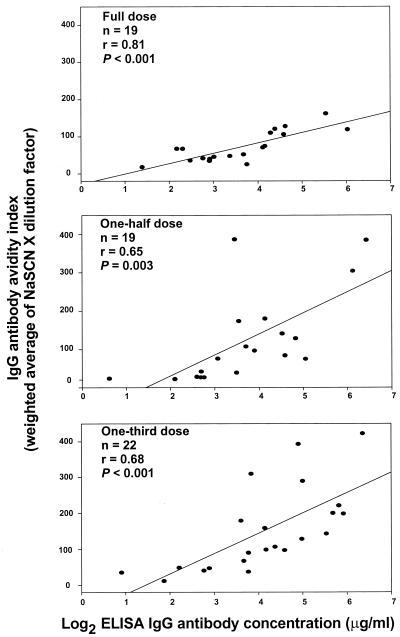
FIG. 1.
Correlation between log2 ELISA IgG antibody concentration and the corresponding IgG antibody avidity index measured as the weighted average of NaSCN concentration times the dilution factor for all three dose regimens. Pearson's product moment correlation coefficient was used to calculate the r and P values. The lines designate the linear correlations between assays.

