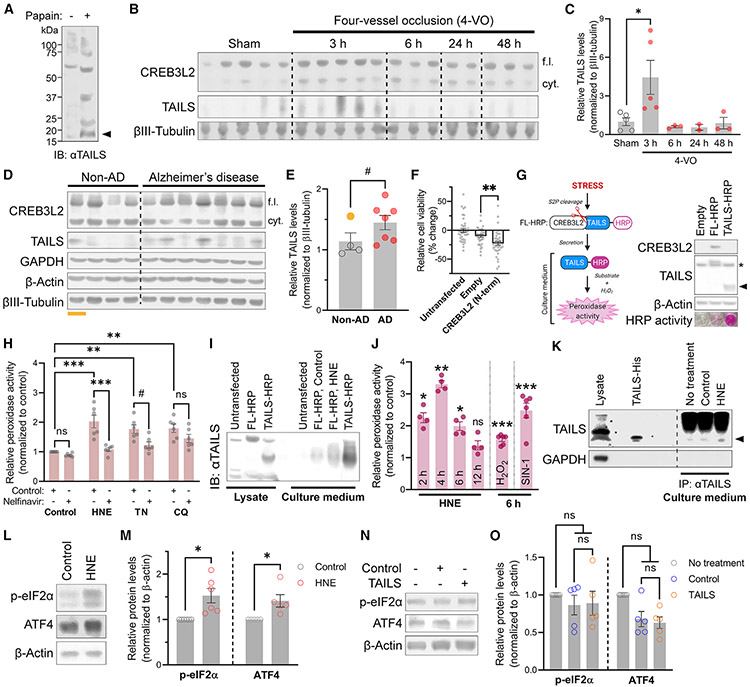
Figure 2. TAILS is generated and secreted under stress or pathological conditions.
(A) Western blot of TAILS in papain-dissociated rat brain. The TAILS band is indicated by an arrow.
(B) Western blot analysis of TAILS protein levels in micro-dissected CA1 tissues of rats after the 4-VO procedure. cyt, cytosolic.
(C) Quantification of TAILS protein levels in (B). Means ± SEM (sham, n = 5; 3-h 4-VO, n = 5; 6-h 4-VO, n = 3; 24-h 4-VO, n = 2; 48-h 4-VO, n = 3). One-way ANOVA, Tukey’s multiple comparisons test. *p = 0.0464.
(D) Western blot analysis of CREB3L2 and TAILS in prefrontal cortices from individuals diagnosed with Alzheimer’s disease (AD). H-I, acute hypoxic-ischemic (underlined, gold).
(E) Quantification of (D). Means ± SEM (non-AD, n = 4; AD, n = 7). Unpaired t test, one-tailed. #p = 0.0672, *p = 0.0434 without H-I sample (gold).
(F) Assessment of the CREB3L2 transcription factor on neuronal viability. Means ± SEM (n = 3 biological replicates; 38–39 wells per condition). One-way ANOVA, Tukey’s multiple comparisons test. **p = 0.008.
(G) Scheme and immunoblotting of the TAILS secretion assay (left). S2P, site 2 protease; HRP, horseradish peroxidase. Immunoblot of FL- and TAILS-HRP expression in HEK293T cells and colorimetric validation of HRP activity in culture media (right). A non-specific band and TAILS-HRP are indicated by an asterisk and an arrow, respectively.
(H) Quantification of TAILS secretion in HEK293T cells treated with oxidative (HNE, 10 μM), ER (TN, 2 μM), and lysosomal (CQ [chloroquine], 10 μM) stress inducers. Means ± SEM (n = 6 biological replicates). One-way ANOVA, Tukey’s multiple comparisons test. #p < 0.1, **p < 0.01, ***p < 0.001.
(I) TCA precipitation of secreted TAILS-HRP from hippocampal neurons expressing FL- or TAILS-HRP.
(J) Time course analysis of the TAILS secretion assay in hippocampal neurons under oxidative stress induced by HNE (10 μM), hydrogen peroxide (H2O2, 200 μM), and SIN-1 (200 μM). Means ± SEM (n = 4 biological replicates). One-way ANOVA, Tukey’s multiple comparisons test. *p < 0.05, **p < 0.01, ***p < 0.001.
(K) Immunoblot comparison of endogenous TAILS proteins immunoprecipitated from neuronal culture media to His-purified recombinant TAILS protein (3 μg). TAILS is indicated by an arrow.
(L) Western blot analysis of ISR pathway components in neurons challenged with HNE (10 μM).
(M) Quantification of (L). Means ± SEM (n = 5–6 biological replicates). Paired t test, two-tailed. *p = 0.0445 (p-eIF2α) and p = 0.0408 (ATF4).
(N) Western blot analysis of ISR pathway components in neurons treated with TAILS-containing or control conditioned medium.
(O) Quantification of (N). Means ± SEM (n = 5 biological replicates). One-way repeated-measures ANOVA, Tukey’s multiple comparisons test.

