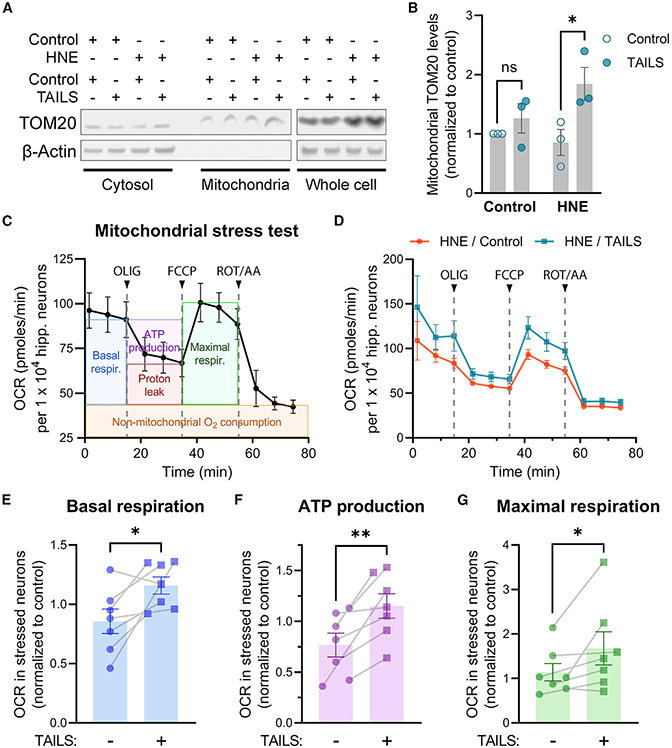
Figure 5. TAILS increases mitochondrial function in HNE-stressed neurons.
(A) Western blot analysis of cyt and mitochondrial fractions from TAILS-treated neurons.
(B) Quantification of TOM20 in (A). Means ± SEM (n = 3 biological replicates). two-way ANOVA, Tukey’s multiple comparisons test. ns, not significant. *p = 0.0471.
(C) Mitochondrial stress test profile of control hippocampal neurons. Key parameters of mitochondrial respiration are illustrated in colored boxes.
(D) Mitochondrial respiration of HNE-treated neurons incubated with TAILS or a control. Oxygen consumption rates (OCRs) were calculated per 10,000 hippocampal neurons. Electron transport chain components inhibited by sequential injection of oligomycin (OLIG; 6 μM, an ATP synthase inhibitor), FCCP (3 μM, an uncoupling agent), and rotenone/antimycin A (ROT/AA; 0.5 μM, complex I/III inhibitors).
(E–G) Quantitative comparisons of basal respiration (E), maximal respiration (F), and ATP production (G) in HNE-treated neurons incubated with TAILS or a control. Means ± SEM (n = 7 biological replicates). Paired t test, one-tailed. *p < 0.05, **p < 0.01.

