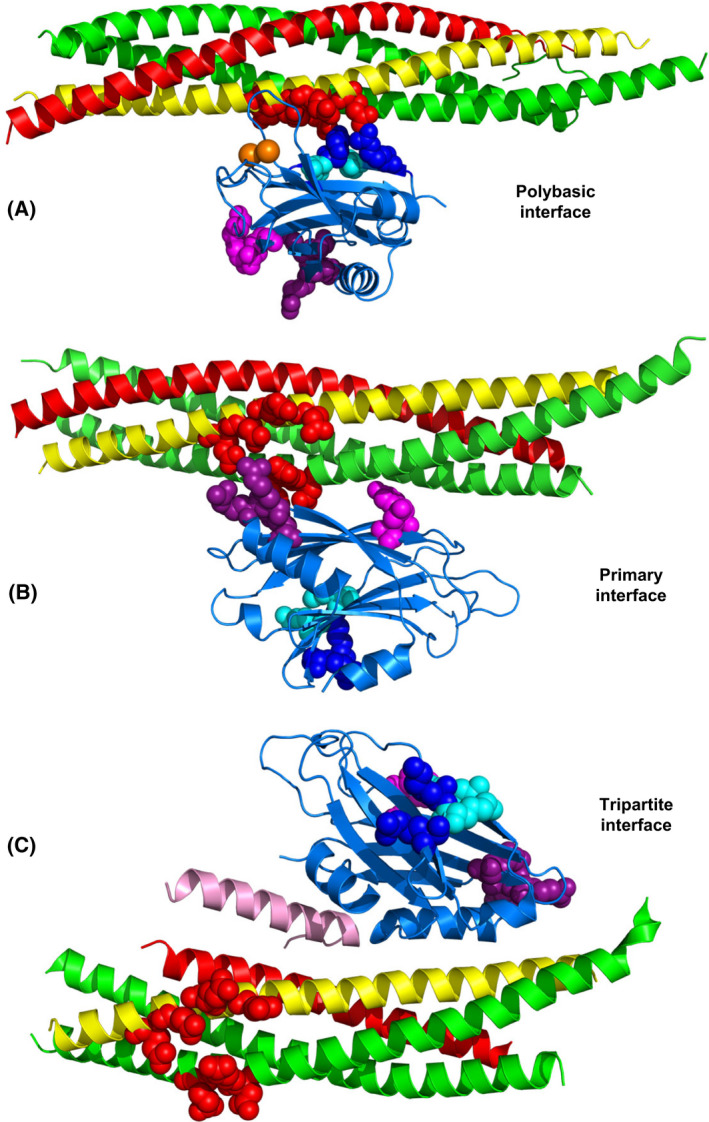
Fig. 5.

Structures of Synaptotagmin‐1‐SNARE complexes. (A–C) Ribbon diagrams of the dynamic structure of a C2B domain‐SNARE complex determined in solution by NMR spectroscopy [112] (A) (only a representative conformer of the large ensemble is shown), of a C2B domain‐SNARE complex determined by X‐ray crystallography [44] (B), and of a C2B domain‐SNARE‐complexin‐1 complex determined also by X‐ray crystallography [138] (C). The PDB accession numbers are 2N1T, 5KJ7 and 5W5C, respectively. The Syt1 C2B domain is in blue, complexin‐1 in pink, synaptobrevin in red, syntaxin‐1 in yellow and SNAP‐25 in green. Selected residues from the C2B polybasic region are shown as blue (R322 and K325) or cyan (K324 and K326) spheres, selected C2B residues that form the primary are shown as pink (E295 and Y338) or deep purple (R281, R398 and R399) spheres, and selected acidic residues of the SNAREs involved in binding to the polybasic region or the primary interface of the C2B domain (D51, E52 and E55 of SNAP‐25, and E224, E228, D231 and E234 of syntaxin‐1) are shown as red spheres.
