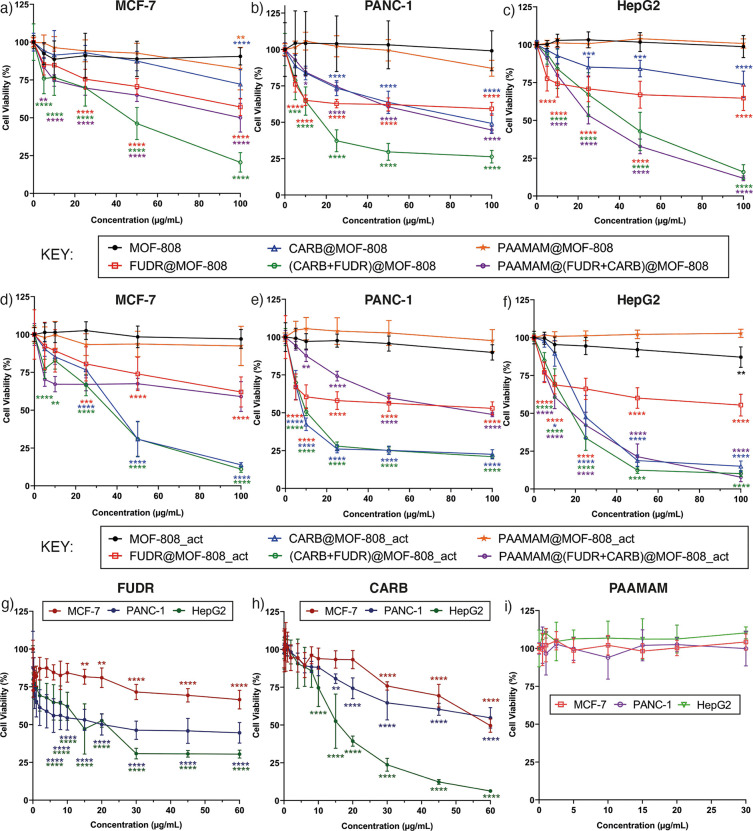
Figure 4.
Cell viabilities of (a) MCF-7, (b) PANC-1, and (c) HepG2 cells treated with MOF-808 and its drug loaded and PAAMAM coated formulations, compared to cell viabilities of (d) MCF-7, (e) PANC-1, and (f) HepG2 cells treated with MOF-808_act and its drug loaded and PAAMAM coated formulations. Cell viabilities of the three cell lines when treated with (g) free FUDR, (h) free CARB, and (i) PAAMAM are also provided for comparison. All incubations carried out for 72 h. Viabilities assessed by the Alamar blue cell viability assay with untreated cells accepted as control. The data were expressed as mean and standard deviation (n = 3 × 3), p ≤ 0.05 (*), p ≤ 0.01 (**), p ≤ 0.001 (***), and p ≤ 0.0001 (****). The stars show the statistical significance of each data point from the control. An inset for part g to show statistical significance below 10 μg mL–1 is provided in Figure S38. The equivalent FUDR and CARB concentrations for each nanoparticle concentration used (between 5 and 100 μg mL–1) are reported in Table S1, and the data plotted as a function of CARB concentration are given in Figure 5, where appropriate.

