
Fig. 3.
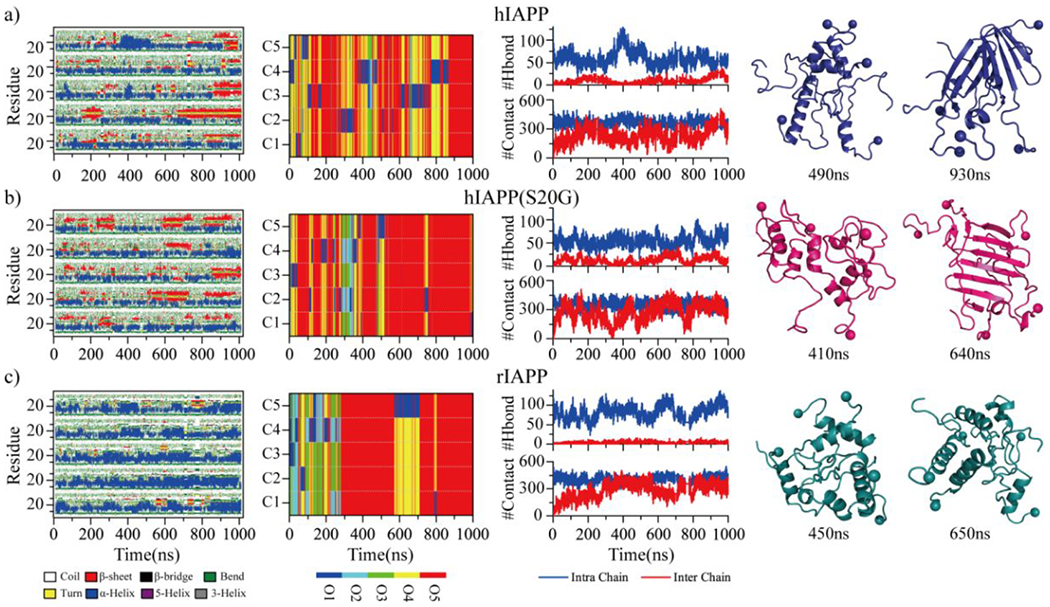
Oligomerization dynamics and conformational changes. The secondary structure of each residue (first column), the oligomer size into which a peptide aggregated (second column), the number of backbone hydrogen bonds and heavy contacts (third column) are presented as the function of simulation time in the representative five-peptide simulation trajectories of hIAPP a), hIAPP(S20G), and rIAPP c). Oligomer size and each peptide chain in the second column are described as O1 to O5 and C1 to C5, respectively. Two representative snapshots populated with helix or β-sheet formations along the simulation trajectories are presented to the right.