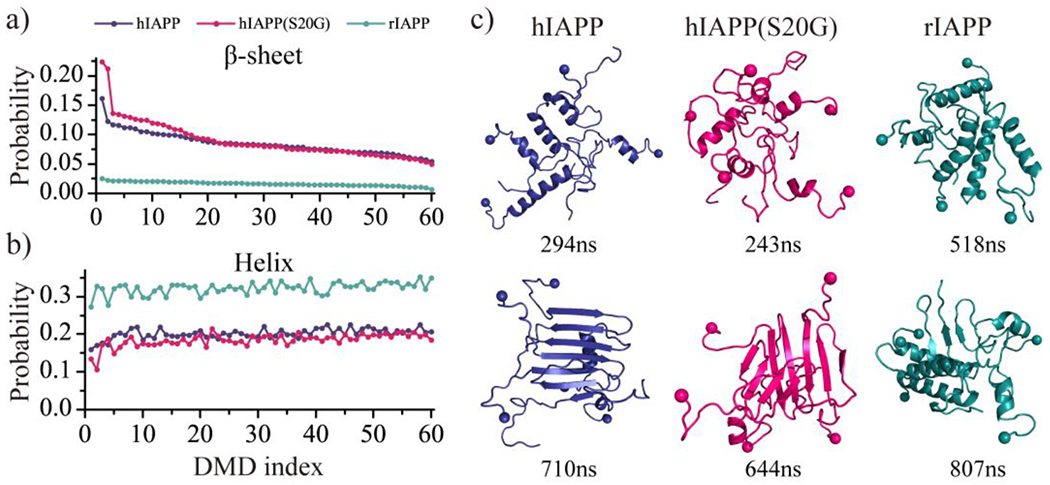
Fig. 4.

The time-average β-sheet and helix propensity of each independent simulation. The time-averaged β-sheet a) or helical b) probability is computed for each independent simulation during the last 500 ns. Simulation trajectories are sorted according to the averaged β-sheet content from high to low. c) One helix-rich and one β-sheet-rich structures from the same top-ranked trajectory are shown for each molecular system.
