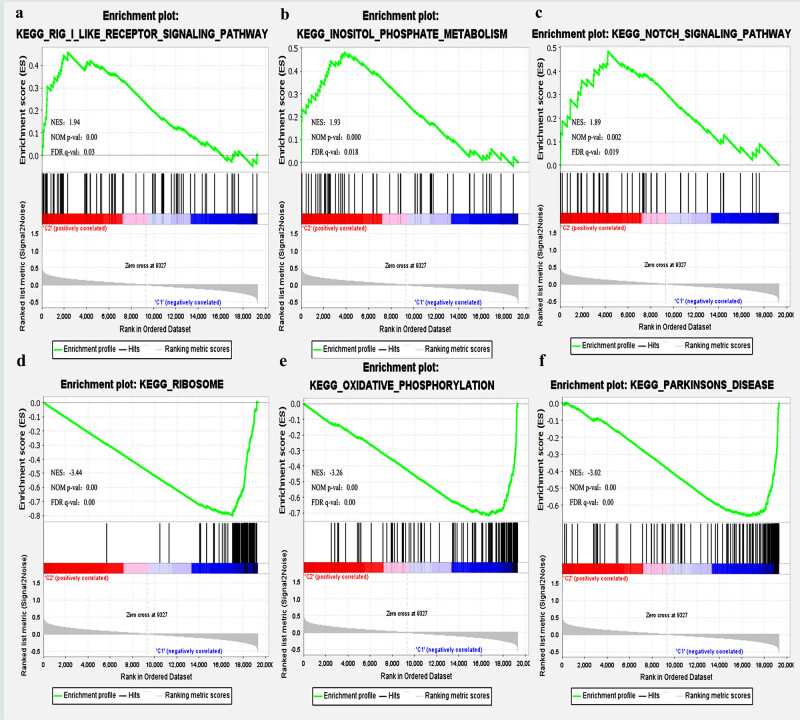
Figure 3.
Potential downstream signal pathways of ASAP3 are revealed through GSEA analysis. Based on GSEA data results, Rig like receptor signaling pathway (a), Inositol phosphate metabolism (b), and NOTCH signaling pathway (c) were enriched in the high ASAP3 expression group. Ribosome (d), oxidative phosphorylation (e), and Parkinson's disease (f) were enriched in the low ASAP3 expression group. The scores for each gene's enrichment are displayed in the top panels. The lower panels display the ranking metrics for each gene. X-axis: rankings for all genes; Y-axis: values of ranking metrics. NES stands for normalized enrichment score.

