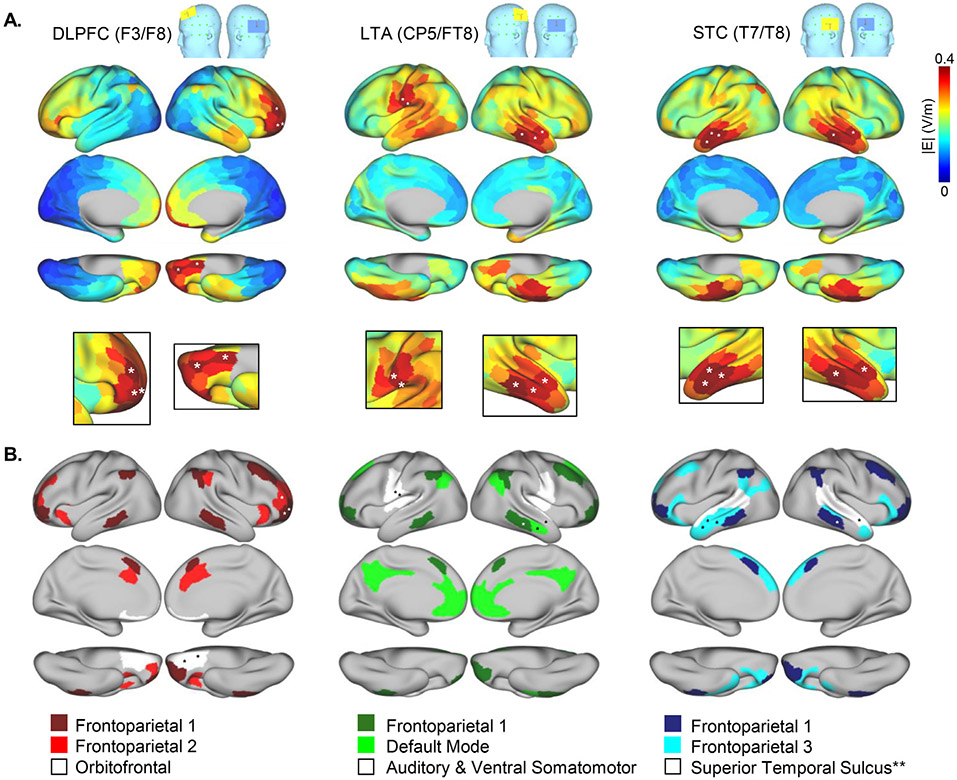
Fig. 3.
High E field nodes and networks. A. E field magnitude is plotted for each node on template cortical surfaces for each electrode montage. White asterisks mark the locations of the five nodes with greatest E field magnitude (i.e., ∣E∣ in V/m) for each montage, estimated using a single template head. B. Resting state networks (RSNs) that contain one or more of the top five nodes identified in A are displayed for each montage. **Note that the “Superior Temporal Sulcus” network was also a high E field network for the LTA (CP5/TP8) montage. Numbers given in the color keys at bottom match the RSN numbers displayed in Fig. 1B and Yeo et al. 2011 indices. In A and B, cortical surfaces are lateral, medial, and ventral displayed from top to bottom.

