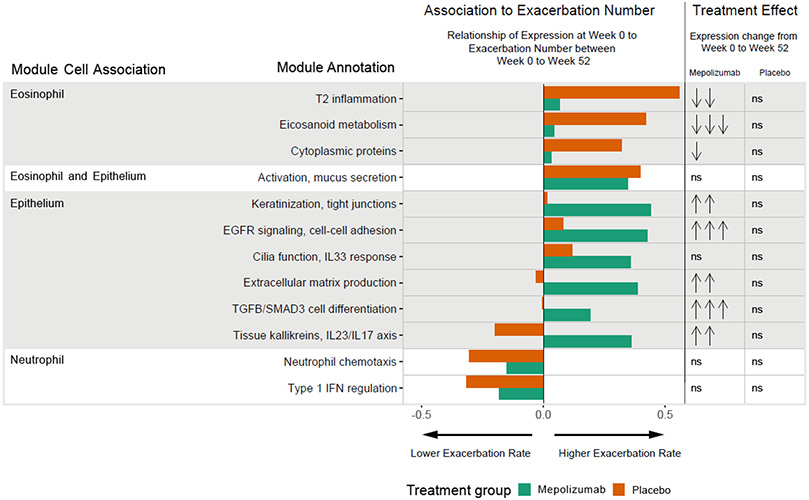
Figure 2. Nasal gene module expression levels are related to exacerbation rate and treatment.
Twelve gene expression modules measured from nasal lavage at the randomization visit, week 0, showed a significant relationship to the primary clinical outcome, the number of exacerbations during the course of the study, in either the placebo and/or mepolizumab treatment groups by multivariate partial least squares regression. Shown are the weights for each of the 12 modules and for each treatment group. Orange indicates a weight value for the placebo group and green for the mepolizumab group. A positive weight (indicated with a bar on the right of center) indicates a positive association with the number of exacerbations, a negative weight (left of center) indicates an inverse association. Weight values can range from 0-1 and in part reflect the relative importance of each module in modeling exacerbation number. Module annotations and cell associations are listed. Eight of these 12 modules showed differential expression from week 0 to week 52 in the mepolizumab group, whereas no modules were differentially expressed from week 0 to week 52 in the placebo group. Significance of differential expression is indicated. No significant change in expression is indicated by “ns”. Downward arrows indicate a decrease in expression, upward arrows an increase. The number of arrows indicates the significance level: one arrow, p<0.05; two arrows, p<0.01; 3 arrows, p<0.001. Further details about each module are in table S4.

