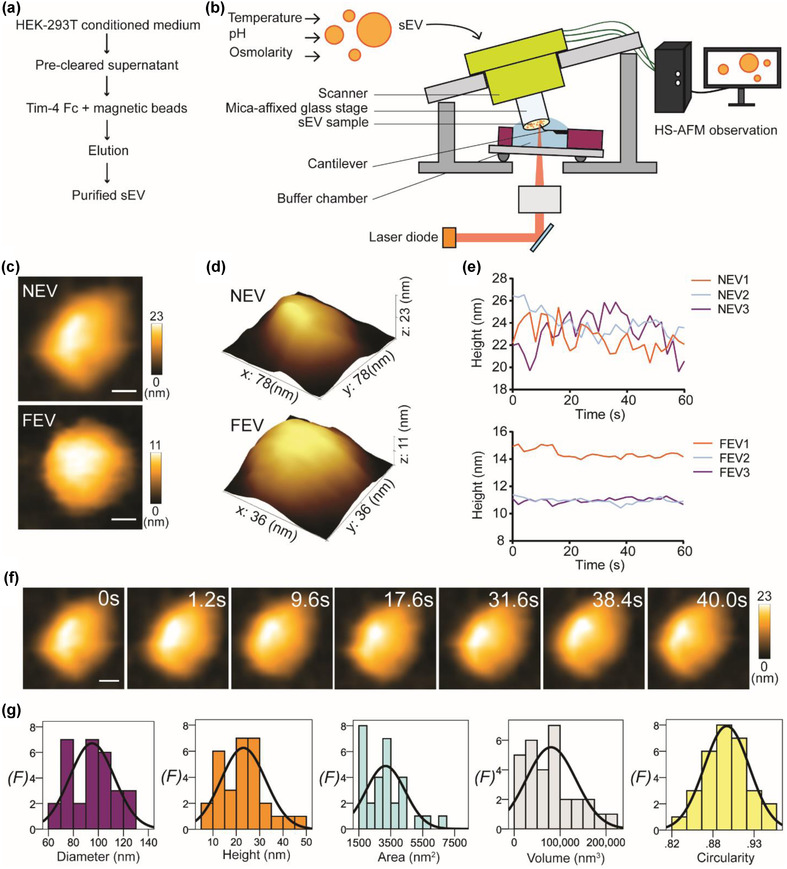
FIGURE 1.

Real‐time visualization of native conformation of sEV in a physiological buffer. (a) A flow chart shows the TIM‐4 affinity purification of HEK293T‐derived sEVs. (b) A schematic diagram illustrates the setup of HS‐AFM for sEVs imaging under different conditions. (c) HS‐AFM images demonstrate the nanotopology of native (NEV) and formalin‐fixed (FEV) sEVs under physiological environment (scale bar, NEV: 18 nm; FEV: 10 nm). (d) 3D structure of NEV and FEV. (e) Line graphs delineate real‐time height of NEV and FEV. Results indicate that formalin fixation could increase the rigidity of sEVs as the height fluctuation is less for FEV compared with NEV. (f) Real‐time image sequence of an NEV. Fluidity of NEV layer is visible during HS‐AFM imaging (scale bar: 18 nm). (g) Spatial dimension analysis of NEV. Results are presented in histograms with normal distribution curves (n = 30; F, frequency)
