FIGURE 2.

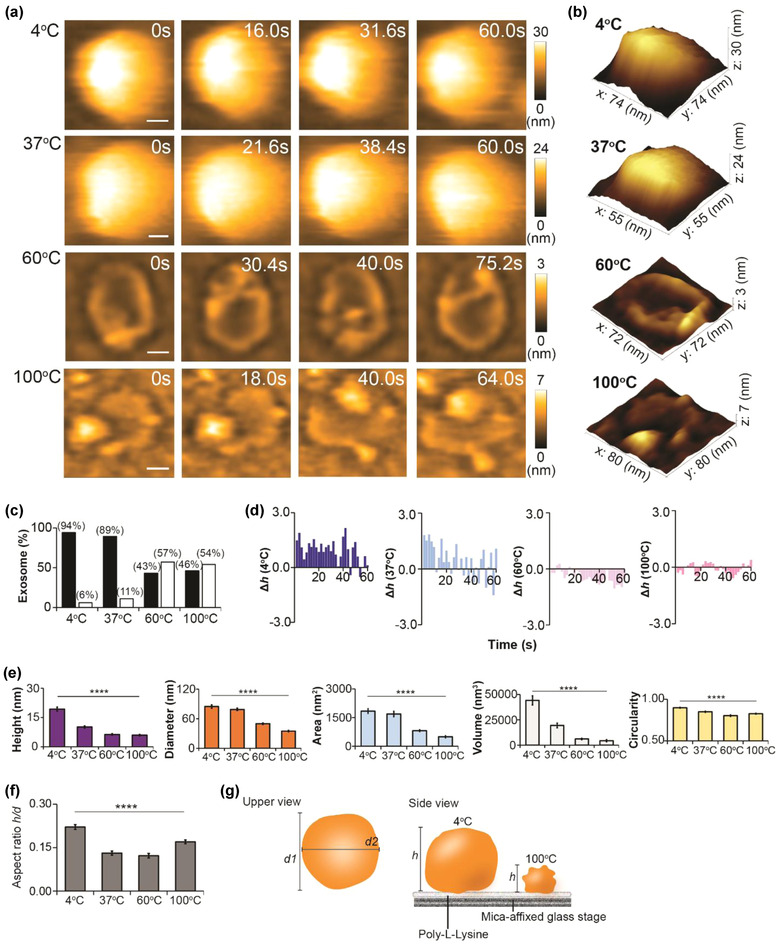
Temperature‐induced nanotopological change in sEV. (a) Direct visualization of sEV after exposure to 4°C, 37°C, 60°C, or 100°C for 4 h (scale bar, sEV4°C: 17 nm; sEV37°C: 11 nm; sEV60°C: 20 nm; sEV100°C: 20 nm). (b) 3D topology of respective sEVs in panel (a). (c) Bar graph demonstrating the percentage of normal and deformed sEVs in four sEV groups (black bar, normal; white bar, deformed). (d) Bar graphs illustrating the real‐time height change (Δh) of four sEV groups (n of each group: 1). The magnitudes of height change for sEV4°C and sEV37°C are greater than those for sEV60°C and sEV100°C. (e) Temperature significantly altering the spatial dimension and circularity of sEV. Comparison is performed using Kruskal‐Wallis H Test, and data are presented as mean ± SEM (****p < 0.0001). p‐values of detailed pairwise comparison are reported in Table S1. (f) Aspect ratio (AR) computed to determine the stretchability of an sEV on PLL‐coated mica substrate. Data are depicted as mean ± SEM (****p < 0.0001). (g) A schematic diagram showing the nanotopology of an sEV after exposure to low or high temperatures (d1, major diameter; d2, minor diameter). Sample sizes for (c), (e), and (f): sEV4°C, 80; sEV37°C, 82; sEV60°C, 92; sEV100°C, 104
