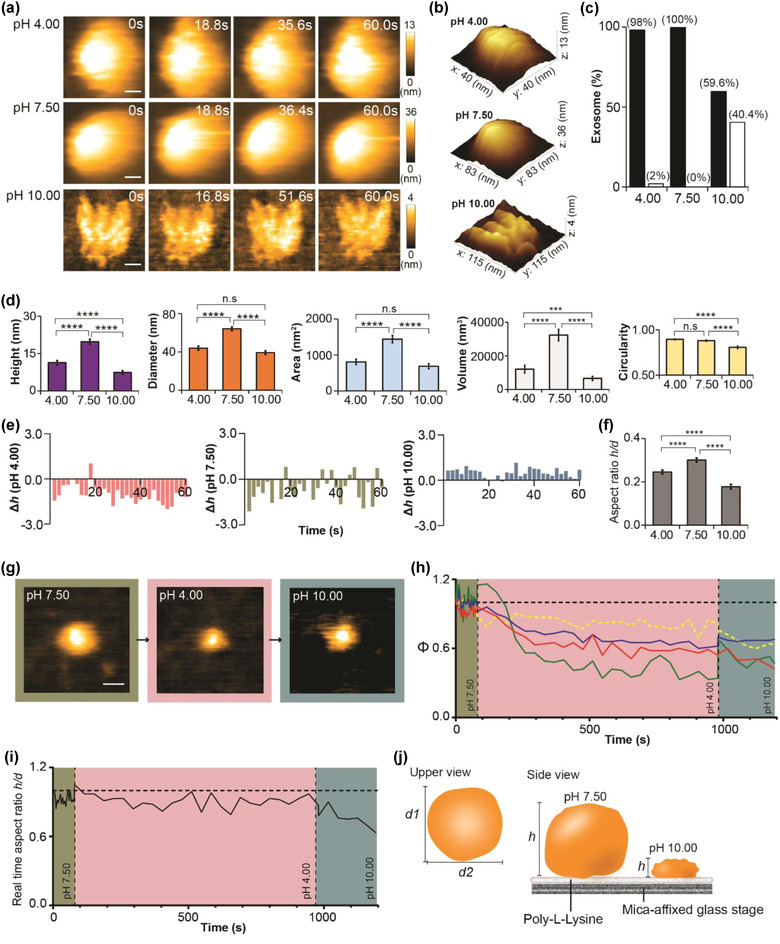
FIGURE 3.

Nanotopological changes of sEVs in response to pH manipulation. (a) sEVs incubated in acidic (pH 4.00), neutral (pH 7.50), or basic (pH 10.00) buffers for 3 h before HS‐AFM imaging. sEV spherical shape is retained at pH 4.00 but deformed at pH 10.00 (scale bar, sEVpH 4.00: 8 nm; sEVpH 7.50: 17 nm; sEVpH 10.00: 23 nm). (b) 3D structure of sEVpH 4.00, sEVpH 7.50, and sEVpH 10.00. (c) Bar graph showing the proportion of deformed sEV after exposure to three different pH levels (black bar, normal; white bar, deformed). (d) pH level significantly alters spatial dimension parameters and circularity of sEV. Data are presented as mean ± SEM (***p < 0.001, ****p < 0.0001, n.s: not significant). (e) Bar graphs presenting the real‐time height changes (Δh) of an sEV pretreated at pH 4.00, pH 7.50, or pH 10.00. (f) sEVpH 10.00 is greatly stretched on PLL‐coated substrate compared with sEVpH 4.00 and sEVpH 7.50. Values are shown as mean ± SEM (****p < 0.0001). (g) Real‐time imaging of sEV nanotopology during pH transition (neutral‐acidic‐basic). sEV shrinks at pH 4.00 and later deforms at pH 10.00 (scale bar: 30 nm). (h) Line graphs demonstrating the real‐time measurement of height, diameter, area, and circularity in response to pH change. The values are illustrated as ratio relative to the initial state (t = 0) (red: height; blue: diameter; green: area; yellow dotted: circularity; green area: pH 7.50; red area: pH 4.00; purple: pH 10.00). (i) Real‐time change in aspect ratio of sEV at different pH levels. The aspect ratio drops in the basic environment, which is consistent to the result in a premix setting (green area: pH 7.50; red area: pH 4.00; purple area: pH 10.00). (j) A schematic diagram delineating the sEV nanotopology at different pH levels. Sample size for (c), (d), and (f): sEVpH 4.00, 52; sEVpH 7.50, 51; sEVpH 10.00, 52
