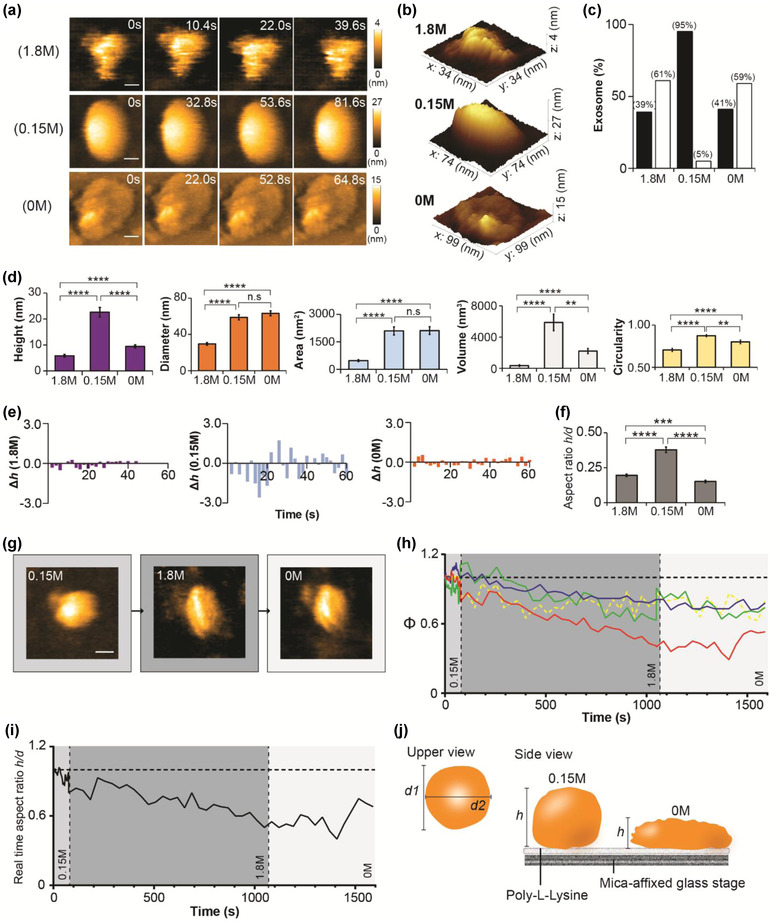
FIGURE 4.

Osmotic stress on nanotopology of sEV. (a) sEVs incubated in a scanning buffer (50 mM Tris‐HCl pH 7.50) with different sodium chloride (NaCl) concentrations (0 M, 0.15 M, and 1.8 M) for 3 h before HS‐AFM observation. sEV structure is clearly deteriorated in hypertonic buffer (1.8 M NaCl) but its spherical shape remains intact in a hypotonic buffer (0 M NaCl) (scale bar, sEV1.8 M: 8 nm; sEV0.15 M: 16 nm; sEV0 M: 22 nm). (b) 3D structures of sEV1.8 M, sEV0.15 M, and sEV0 M. (c) Bar graph showing the percentage of deformed sEVs after exposure to different levels of osmotic stress (black bar, normal; white bar, deformed). (d) Osmotic stress significantly changes the spatial dimension and circularity of sEV. Mann‐Whitney U test is performed, and data are presented as mean ± SEM (**p < 0.01, ***p < 0.001, ****p < 0.0001, n.s: not significant). (e) Bar graphs illustrating the real‐time height change (Δh) in sEVs after treated with hypo‐, iso‐, or hypertonic buffer. Results show that both hypertonic and hypotonic buffers reduce the height change of an sEV. (f) Bar graph demonstrating the aspect ratio is significantly reduced in sEV1.8 M and sEV0 M. Data are depicted as mean ± SEM. (g) Real‐time tracing of nanotopological change in an sEV in response to different levels of osmotic stress (scale bar: 40 nm). (h‐i) Hypertonic condition induces an irreversible change in the sEV structure, and hence the sEV fails to revert to its initial bulging shape in hypotonic condition. The values are illustrated as ratio relative to the initial state (t = 0) (red: height; blue: diameter; green: area; yellow dotted: circularity; medium grey area: 0.15 M; dark grey: 1.8 M; white area: 0 M). (j) A schematic diagram showing nanotopology of an sEV at isotonic or hypotonic conditions. Sample size of (c), (d), and (f): sEV1.8 M, 51; sEV0.15 M, 40; sEV0 M, 44
