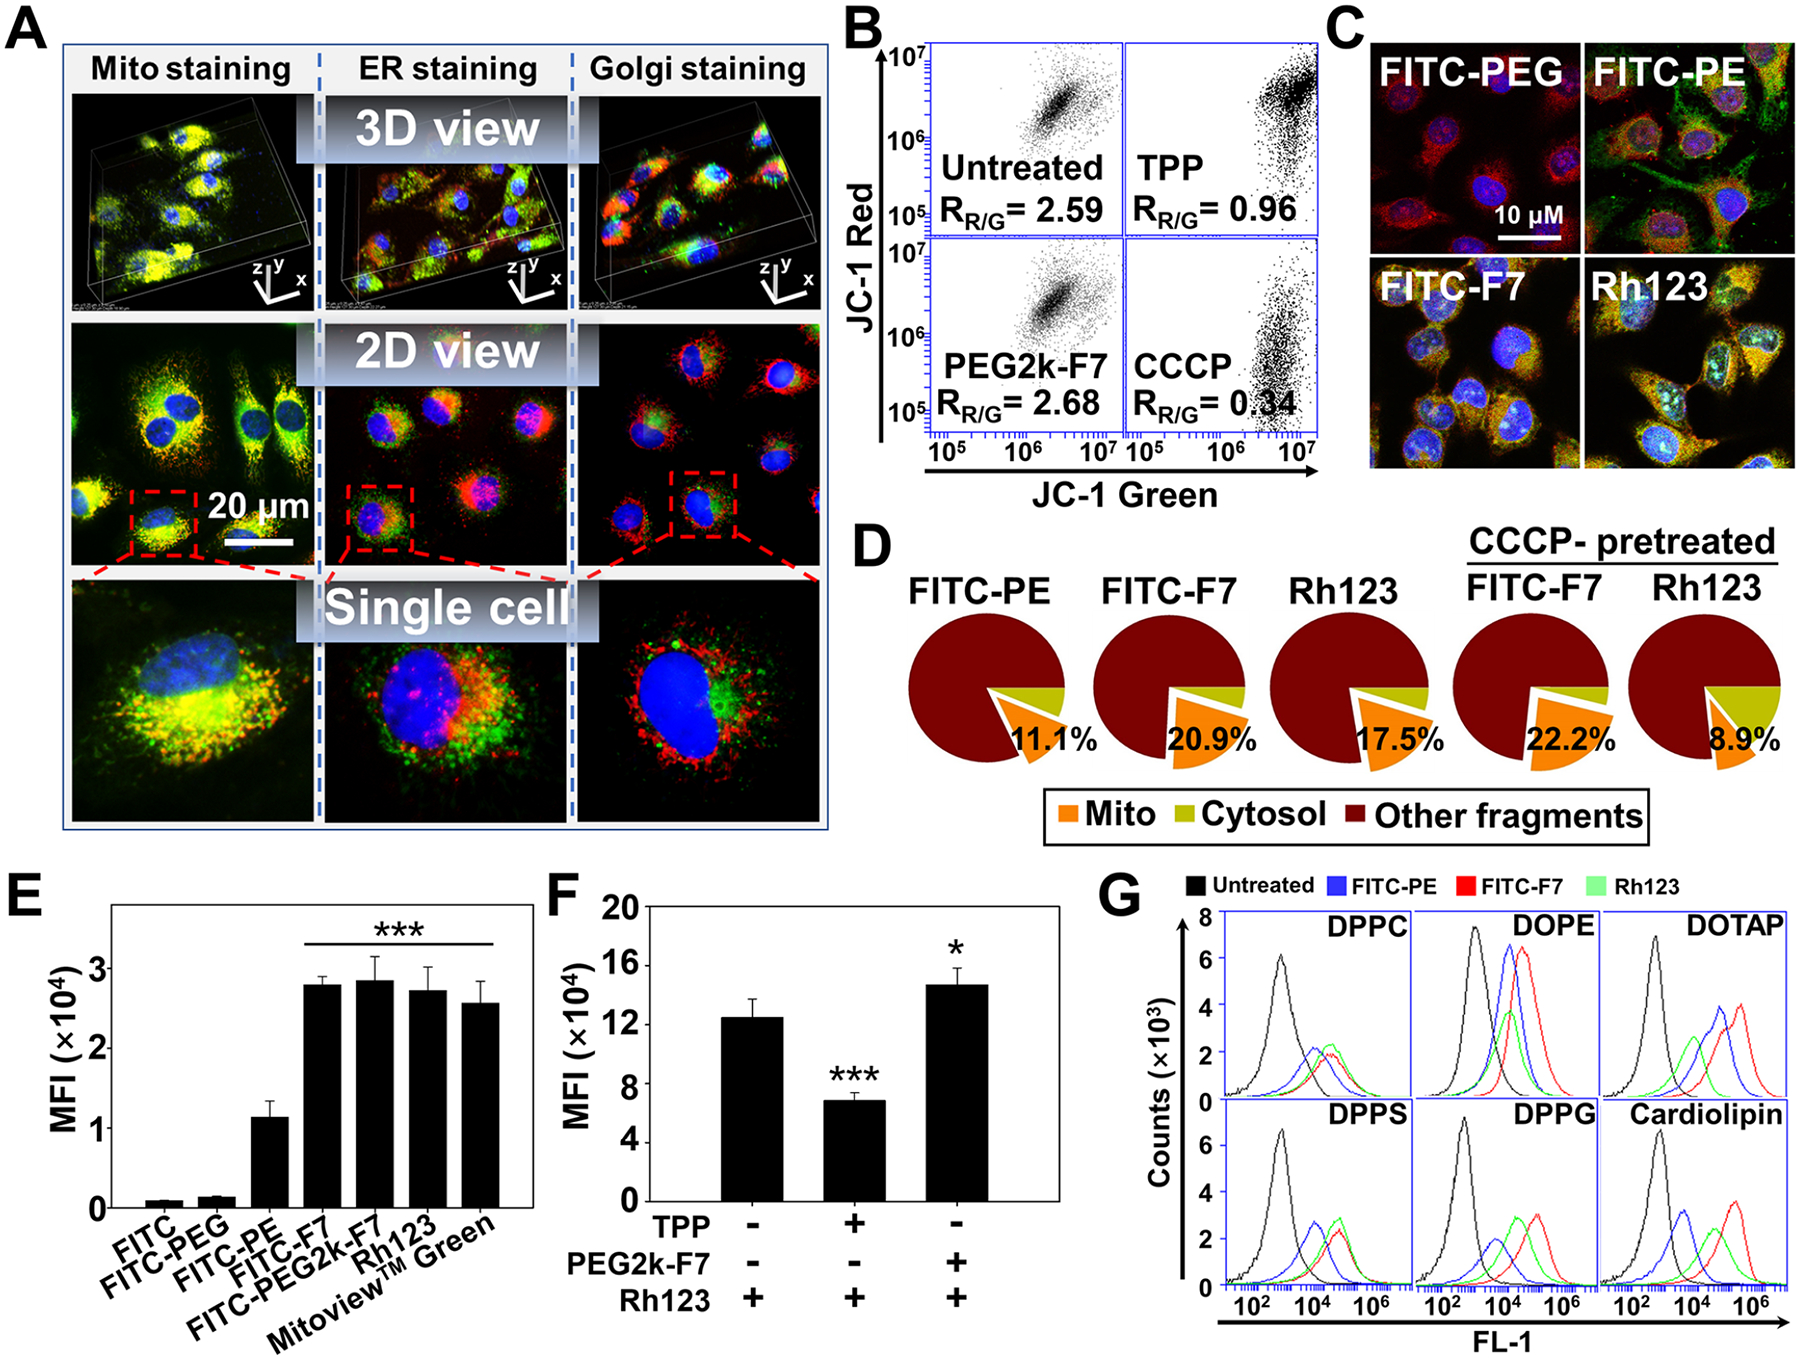
Figure 3.

Potential-independent mitochondrial targeting. (A) Intracellular localization of the Rh-PE-labeled micelles. Incubation time: 1 h. Mitochondria were stained by the MitoView Green. ER was stained by the ER-Tracker Green. Golgi apparatuses were stained by the NBD C6-ceramide. Mitochondria, ER, and Golgi showed green fluorescence. Cell nuclei were stained by the Hoechst 33258 (blue). (B) Mitochondrial membrane potential determined by the JC-1 dye. The decrease in the red/green ratio (RR/G) indicates the mitochondrial depolarization. (C) Colocalization of the FITC-labeled materials with mitochondria. Incubation time: 1 h. Mitochondria were stained by the MitoView 633 (red). (D) Quantification of the mitochondria-associated polymers. The cells were incubated with the FITC-labeled polymers for 1 h, followed by the mitochondrial isolation and fluorescence quantitation. To study the influence of the mitochondrial depolarization, the cells were preincubated with the CCCP for 15 min before 1 h polymer incubation. (E) Direct binding affinity. The isolated mitochondria were incubated with the FITC-labeled polymers or dyes at 37 °C for 1 h. The mitochondria-associated fluorescence was quantitated. (F) Competitive binding assay. The isolated mitochondria were preincubated with either the TPP or PEG2k-F7 at 37 °C for 1 h, followed by incubation with the Rh123 for 1 h. The mitochondria-associated Rh123 was quantitated. (G) Polymer–lipid binding. The liposomes were incubated with the FITC-labeled polymers or Rh123 at 37 °C for 1 h, followed by flow cytometry. MFI, mean fluorescence intensity. Cell line in (A–D): HeLa cells. Data were expressed as the mean ± SD, ***p < 0.001, when compared to the FITC, FITC-PEG, or FITC-PE (E), *p < 0.05; ***p < 0.001, when compared to the Rh-PE group in the absence of polymers (F).
