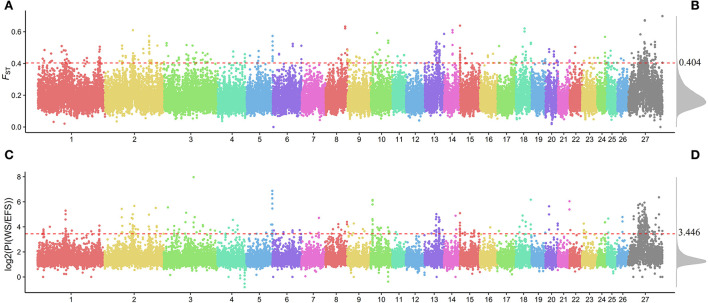
Figure 3.
Genome-wide distribution of FST and θπ ratio. (A) Genome-wide distribution of FST. (B) Genome-wide density distribution of FST. (C) Genome-wide distribution of PI [log2(PI(WS/EFS))]. (D) Genome-wide density distribution of PI. The horizontal red dashed line in the figure shows the window for the top 1% of FST and PI.

