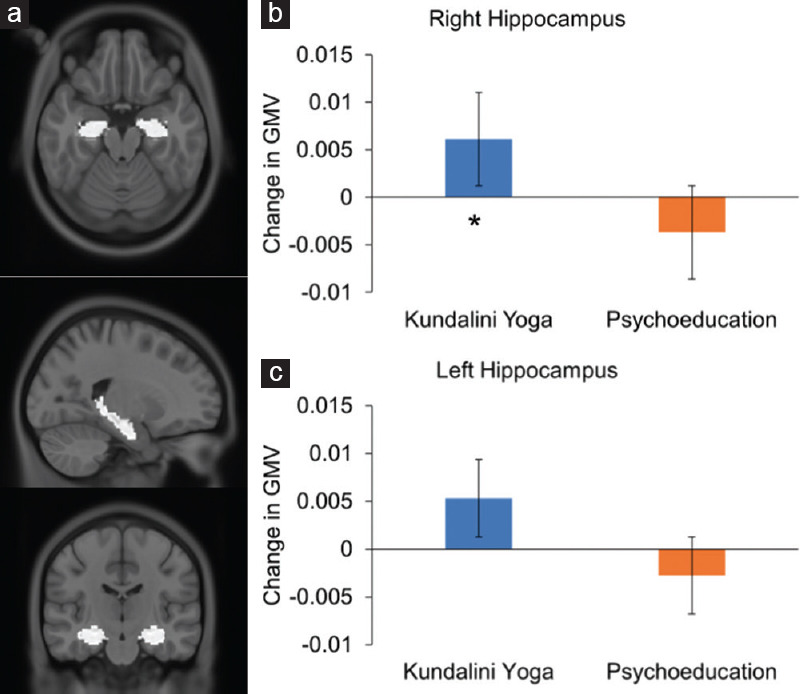
Figure 2.

(a) Bilateral hippocampus ROIs defined using the DKT atlas. (b) Mean change in GMV in the right hippocampus. Asterisk notes a statistically significant difference in mean volume of the Kundalini yoga group from pre to post intervention (t (6) = 3.109, P = 0.021). (c) Mean change in GMV in the left hippocampus. Error bars show standard error. DKT: Desikan-Killiany-Tourville, GMV: Gray matter volume, ROIs: Regions of Interest
