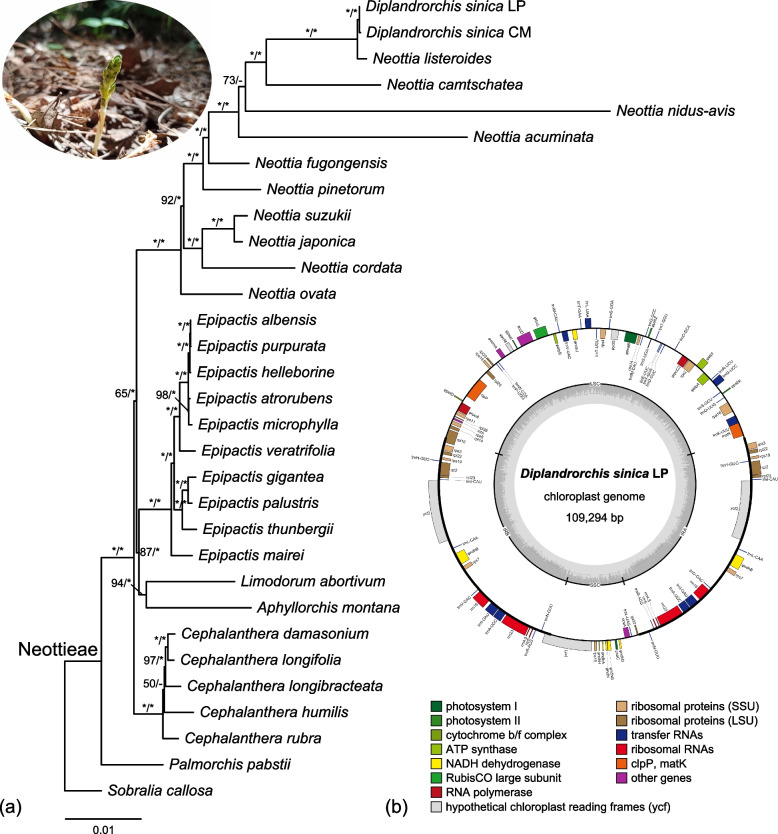
Fig. 1.
a Maximum likelihood tree of Neottieae inferred from the combined plastome and nuclear dataset. Numbers above branches are bootstrap values and Bayesian posterior probabilities. “*” indicate BS = 100% or PP = 1.0. “-” indicates the node not supported in the Bayesian analysis. b Circular gene map of the plastome of Diplandrorchis sinica from the Loess Plateau. Genes inside and outside the circle are transcribed in clockwise and counterclockwise directions, respectively. The dark gray inner circle corresponds to the G/C content, and the light gray circle represents the A/T content. Pseudogenes are marked with “φ”. Mycoheterotrophic Diplandrorchis sinica under the mixed deciduous broadleaf-conifer forest is presented in the upper left. Photographed by H.W. Peng. LP = Loess Plateau; CM = Changbai Mountains

