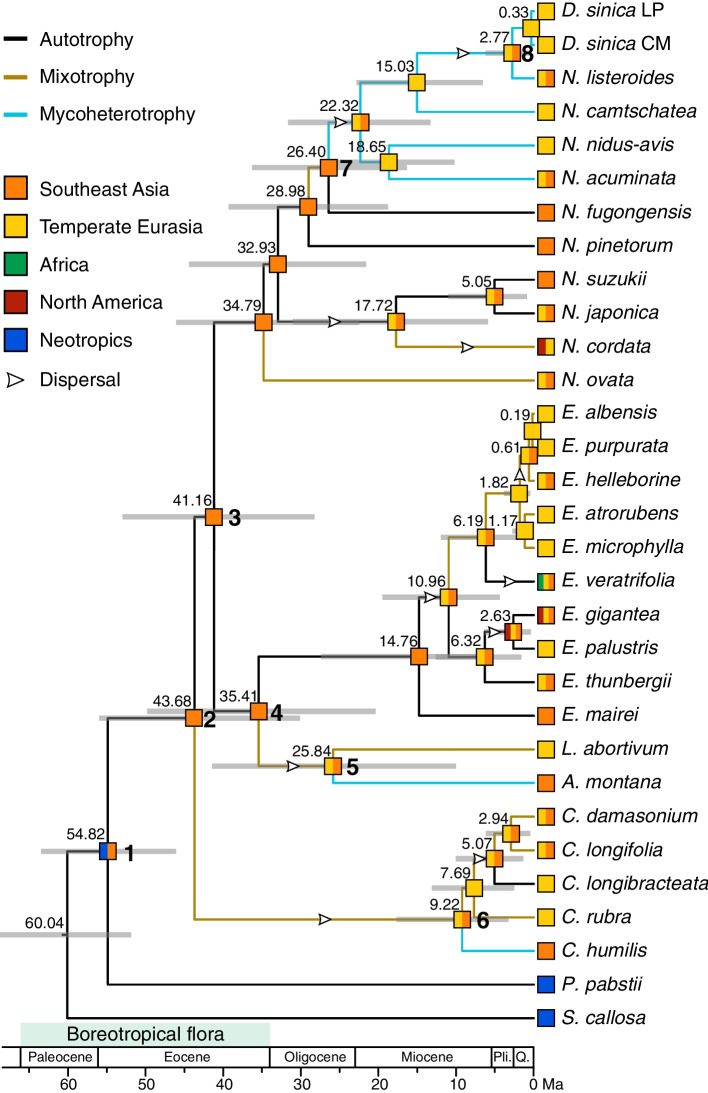
Fig. 3.
Evolutionary inference of nutrition types and ancestral range reconstruction for Neottieae. The chronogram with nodes represented by their mean ages was generated using BEAST. Gray bars represent 95% highest posterior density intervals. Nodes of interest are marked as 1–8 in bold. The most likely ancestral range estimated using BioGeoBEARS under the statistical DEC model is presented at each node as a colored square. The branch colors indicate ancestral nutrition strategy with the maximum probability inferred by BayesTraits. Pli. = Pliocene; Q. = Quaternary

