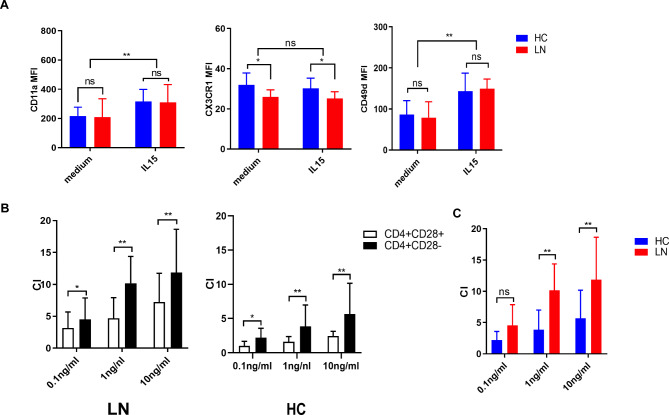
Fig. 5.
IL-15 promotes migration potential of CD4 + CD28− T cells
(A) PBMCs of 8 healthy controls and 8 LN patients were stimulated with IL-15 (50ng/ml) or left untreated for 48-72 h and expression levels of CD11a, CD49d and CX3CR1 were measured by flow cytometry. The MFI of each marker within CD4 + CD28−T cells is shown
(B) Sorted CD4 + T cells of 8 healthy controls and 8 LN patients were allowed to migrate in a transwell system toward different concentrations of IL-15 (0.1–10ng/ml). The number of migrated CD4 + CD28 + and CD4 + CD28− T cells was checked by flow cytometry. The chemotactic index (CI) was calculated as follows: (number of migrated cells with IL-15)/(number of migrated cells without IL-15) as described by Bieke Broux etc. CI of CD4 + CD28− T cells was compared with CI of CD4 + CD28 + T cells both in LN and HC
(C)Within CD4 + CD28− T cells, CI of SLE patients were compared with that of HCs. *p < 0.05, **p < 0.01, ***p < 0.001, ns means no significant

