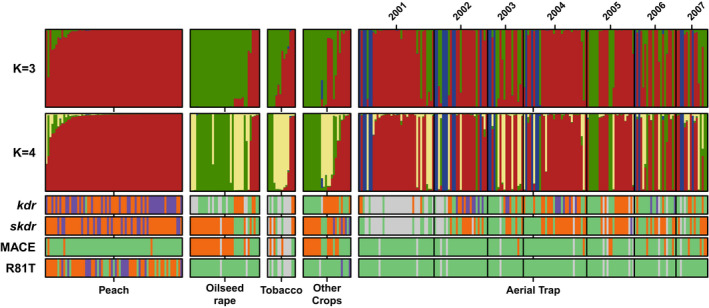
FIGURE 1.

Genetic structure of Myzus aphids sampled in the air and on different crops. Top two lines, Q plot from the structure analysis of microsatellite multilocus genotypes, with K = 3 and K = 4. A vertical line represents an individual, and the proportion of its assignment to each cluster is represented by the colored segments. The colors of the clusters identified in K = 4 are used throughout the paper to designate the associated genetic clusters (red, green, yellow, and blue). Lower lines, visualization of resistance genotypes identified in each individual, with the following color code: light green, susceptible homozygote, purple, resistant homozygote, orange, heterozygote carrying the susceptible wild‐type allele and a mutant allele, gray, missing data. kdr and skdr loci are linked to pyrethroids target site resistance, MACE locus to pirimicarb target site resistance, and R81T locus to neonicotinoids target site resistance. The sampling sources (different crops and aerial trapping) are indicated at the bottom. The sampling years for the aerial trapping are indicated at the top
