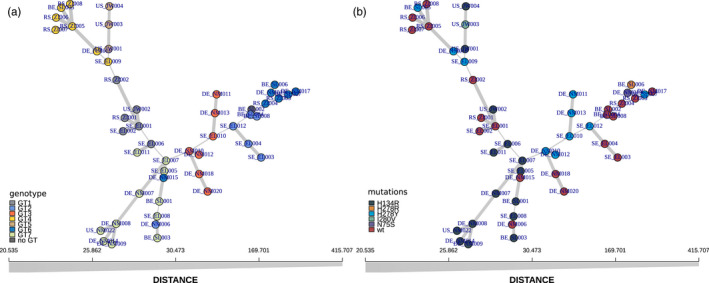
FIGURE 4.

Minimum spanning network analyses (MSN) for our A. solani samples. MSN showing the relatedness of the samples as produced by the R package poppR. Both panels show the same network, with identical scaling (x axis). Each circle represents an individual isolate. Colours in (a) correspond to previously assigned genotypes, colours in (b) highlight the isolate's SDHI mutations
