
FIGURE 3.
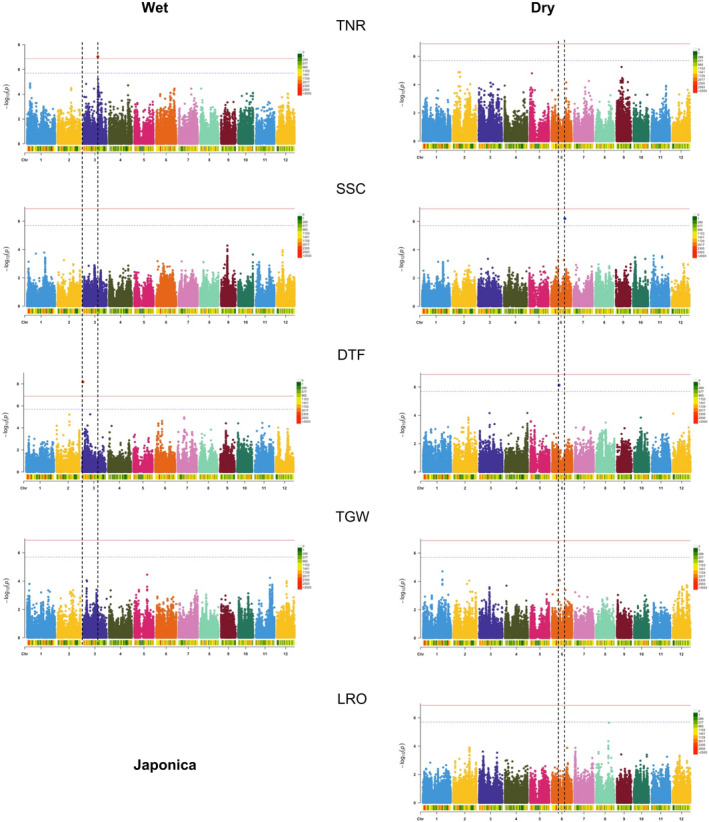
Multi‐trait GWAS for experimental populations of the Japonica varietal group grown in wet and dry conditions. SNPs in peaks whose p value—depicted as –log10(P) on the y axis—passed the Bonferroni threshold (red horizontal line) or the less stringent SimpleM threshold (blue horizontal line) are marked with black vertical lines to facilitate cross‐trait comparisons of SNP associations. The colored bar underneath the x axis of each Manhattan plot shows the SNP density per every 1 Mbp. TNR, vegetative‐stage tiller number; SSC, soluble sugar concentration; DTF, days until flowering; TGW, 1000‐grain weight; LRO, leaf rolling