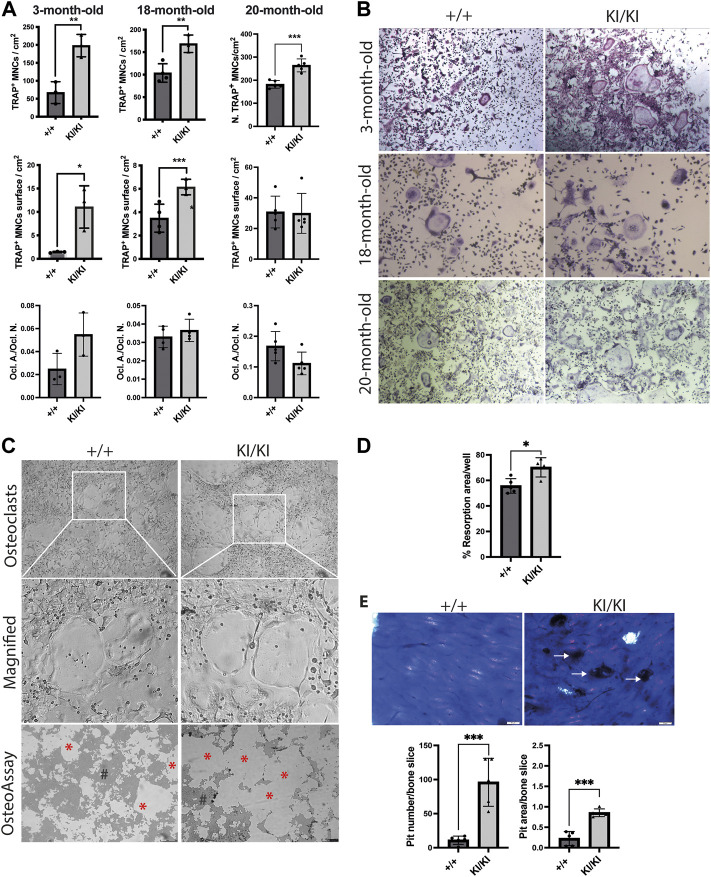
FIGURE 5.
CS Hras G12V mutation enhances osteoclast differentiation in a cell autonomous and a donor mouse age-independent mechanism and CS KI/KI osteoclast (A) TRAP quantification of osteoclast number, osteoclast surface, the ratio between osteoclast number and osteoclast surface and (B) representative images of osteoclasts derived from bone marrow cells collected from various CS age groups. Cells were imaged at ×5 magnification with Leica DMIL LED microscope (Leica) (C) Representative images from OsteoAssay resorption assay imaged at ×5 magnification with Leica DMIL LED microscope (Leica) for osteoclasts and with Leica DMI6000B fully automated inverted microscope for resorption areas. Red stars (*) mark the resorbed area on OsteoAssay surface plates while # mark the non-resorbed area. Scale bar 250 µm (D) Resorption pit analysis of 15-month-old CS bone marrow cells on Osteo Assay Surface plates. (E) Representative images and resorption pit analysis of 15-month-old CS bone marrow cells on bovine cortical bone slices. Representative images of resorption pits on bone slices imaged with Olympus BX41 microscope at ×4 magnification. Scale bar 50 µm. 3-month-old-mice (n= 3), 15-month-old-mice (n = 4), 18-month-old-mice (n = 3–4), 20-month-old-mice (n = 5). Data are shown as mean ± SD. Statistical differences were analysed by unpaired 2-tailed student’s t-test where *p < 0.05, **p < 0.01, ***p < 0.001.

