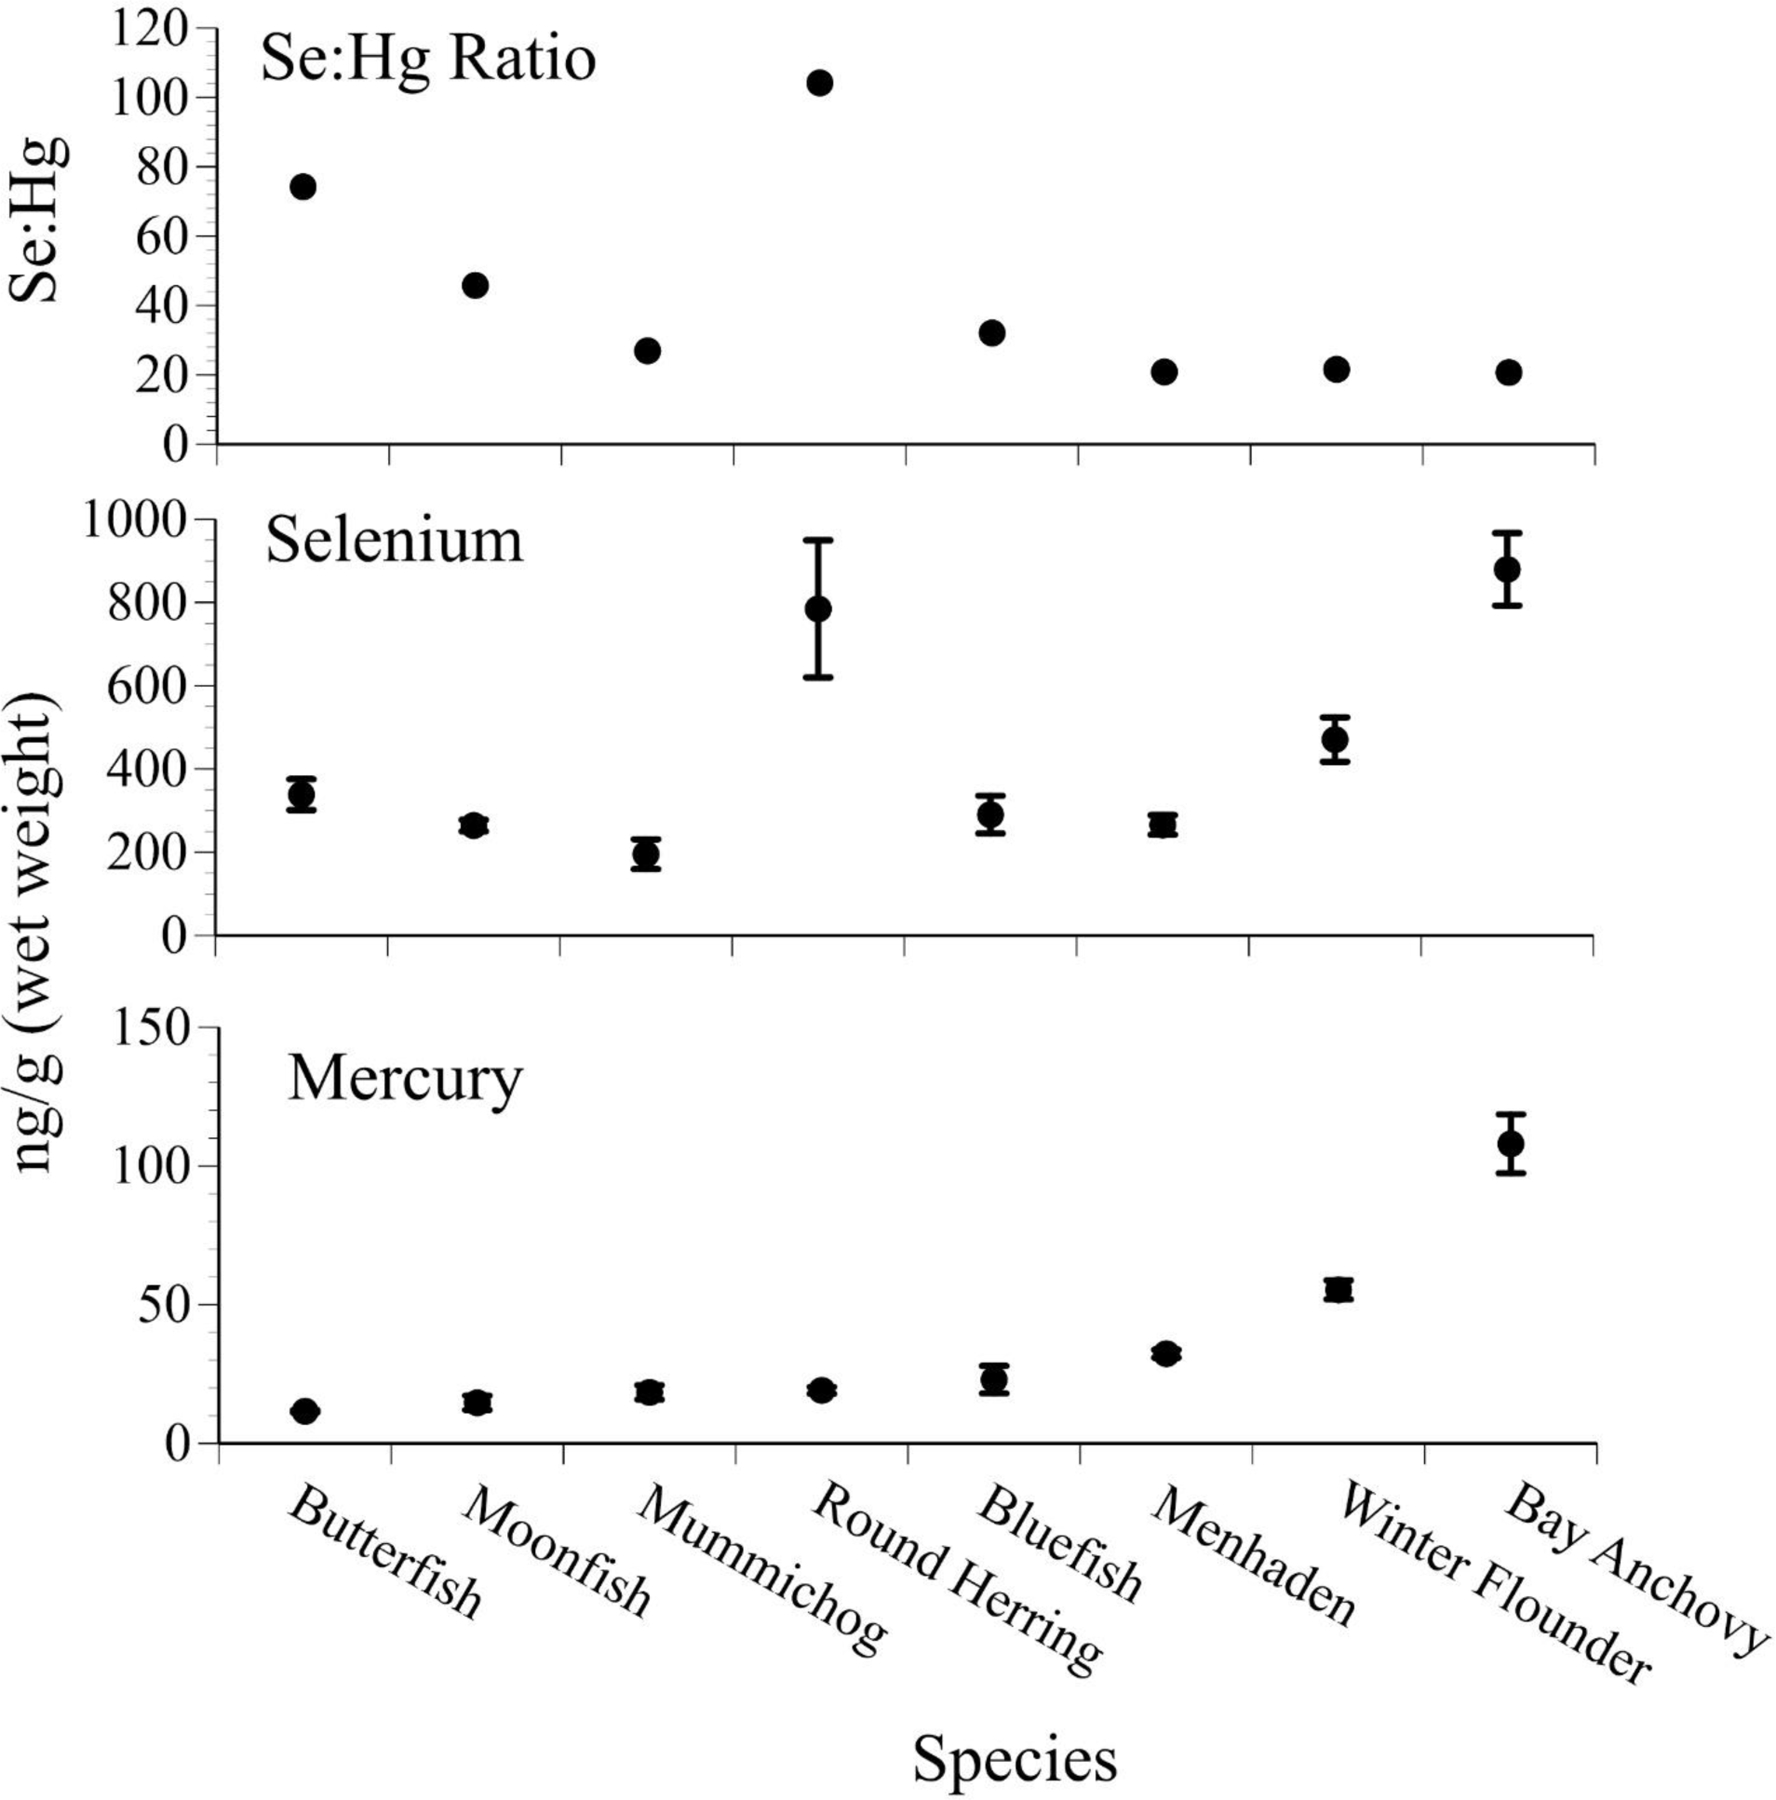
Figure 5.

Mean ± SE levels (ng/g, wet weight, n=25–88) of selenium, mercury, and selenium:mercury molar ratios in several small “bait” fish species collected from Barnegat Bay that are prey for common terns and other birds, as well as for larger fish (after Burger and Gochfeld 2016, unpubl. data). The prey fish were brought back to the nest to feed chicks (2001–2014; small SE indicates little variation over the years).
