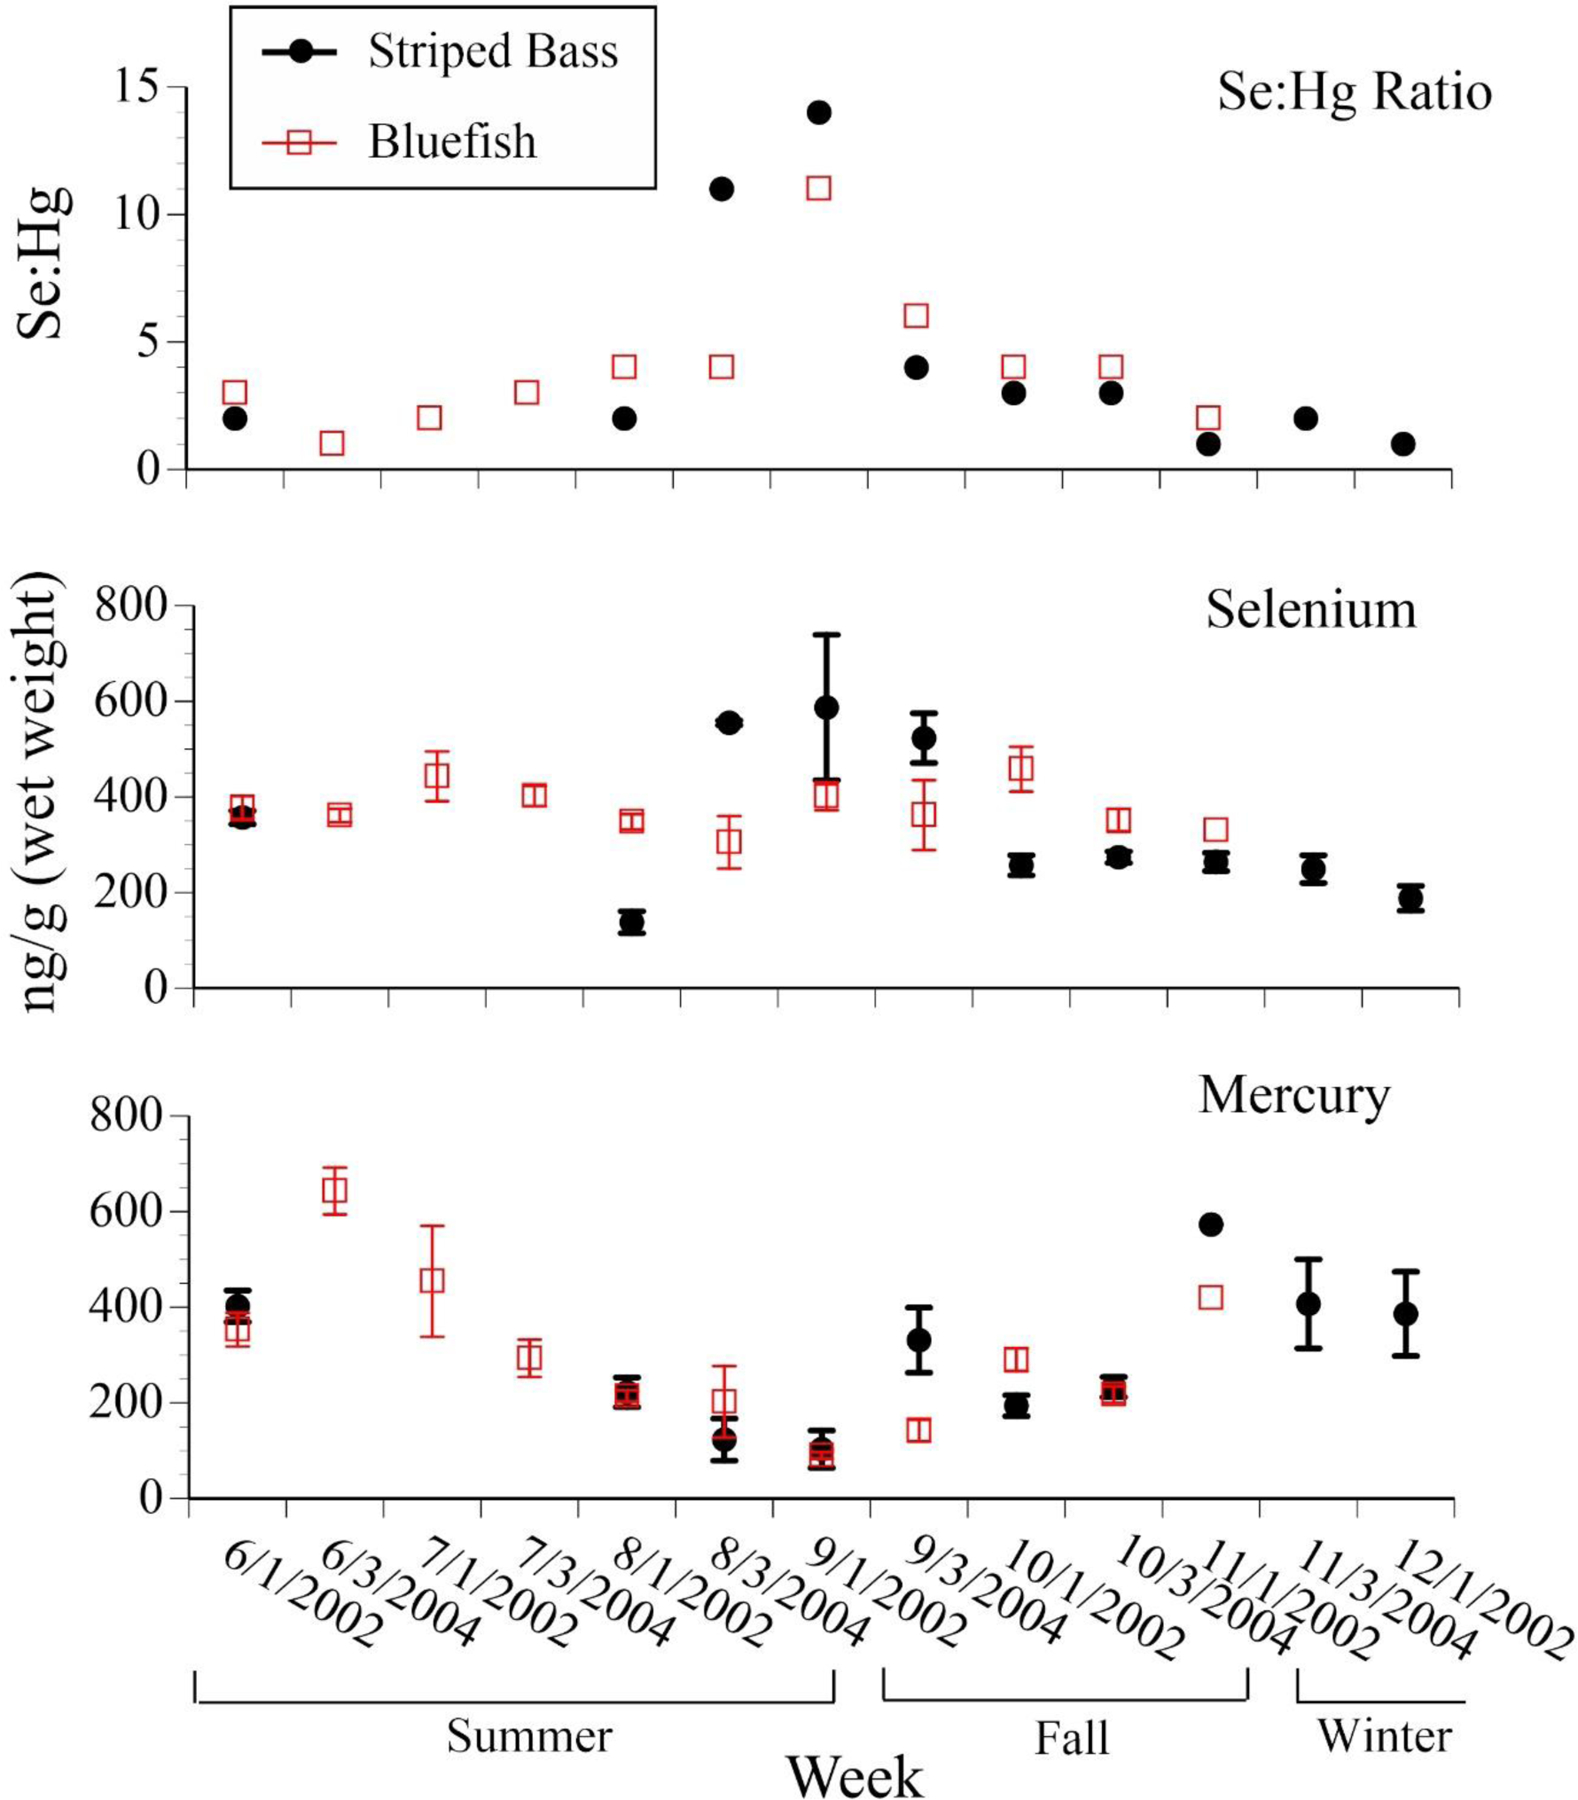
Figure 8.

Mean ± SE levels (ng/g, wet weight) of selenium, mercury, and selenium:mercury molar ratios in bluefish and striped bass collected from people fishing recreationally along the Jersey coast, as a function of season (after Burger 2009; Gochfeld et al. 2012, unpubl. data)..
