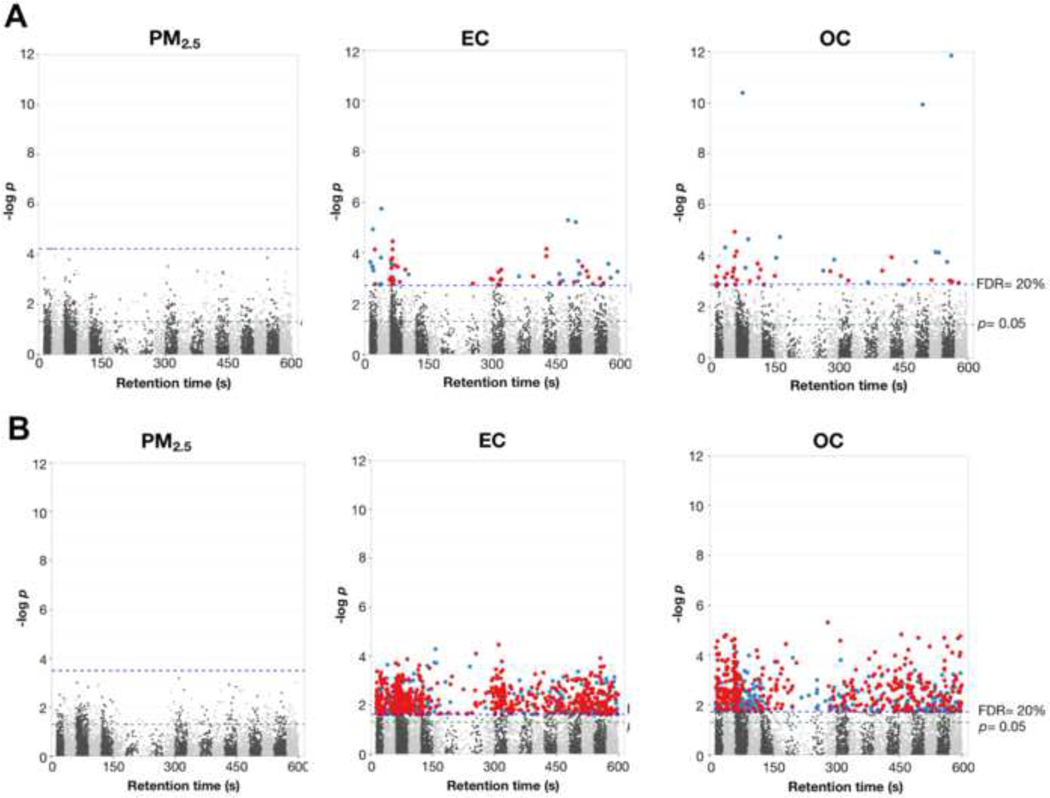
Figure 1:
Manhattan plot showing −log p as a function m/z feature retention time for A) daily and B) week-average exposure to PM2.5, EC and OC. MWAS was completed using linear mixed effects models and post-shift metabolite intensity only. Fixed effects included daily shift length exposure, age, day and BMI. Red= positive association; Blue= negative association

