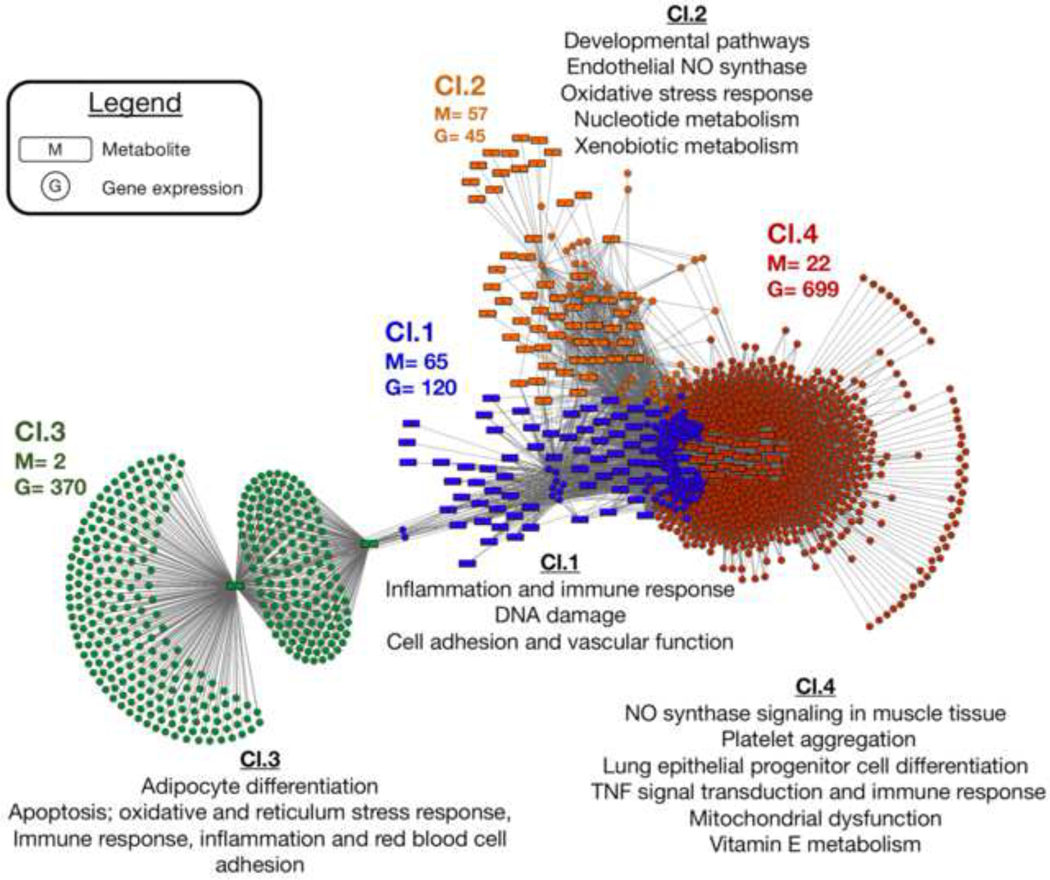
Figure 4:
Metabolite and gene expression integration network. Discriminatory features and network correlations were determined using the R package xMWAS. The top discriminatory genes and identified metabolites were first selected using multilevel sparse partial least squares regression analysis, which were then evaluated for correlation with |r|≥ 0.4 and p< 0.05. Clusters of gene expression and metabolite profiles were identified using a using multi-level community detection algorithm that groups nodes showing a high-degree of connection among each other and are less connected to other nodes in the network (cluster 1= blue nodes, cluster 2= orange nodes; cluster 3= green nodes; cluster 4= red nodes). Each cluster was then evaluated for biological activity and overlap between metabolite and gene expression pathways. Three of clusters that were identified included both metabolites and genes; cluster 3 was predominantly genes and only included two metabolites, suggesting a minimal degree of overlap between metabolic and gene expression related processes present in cluster 3. For each cluster, the main pathways linked to endothelial function, inflammation, oxidative stress and related are provided; a full list of gene expression and metabolite pathways present in the correlation network are provided in Supplementary Table 5. Cl= Cluster; M= metabolite node, G= gene expression node.

