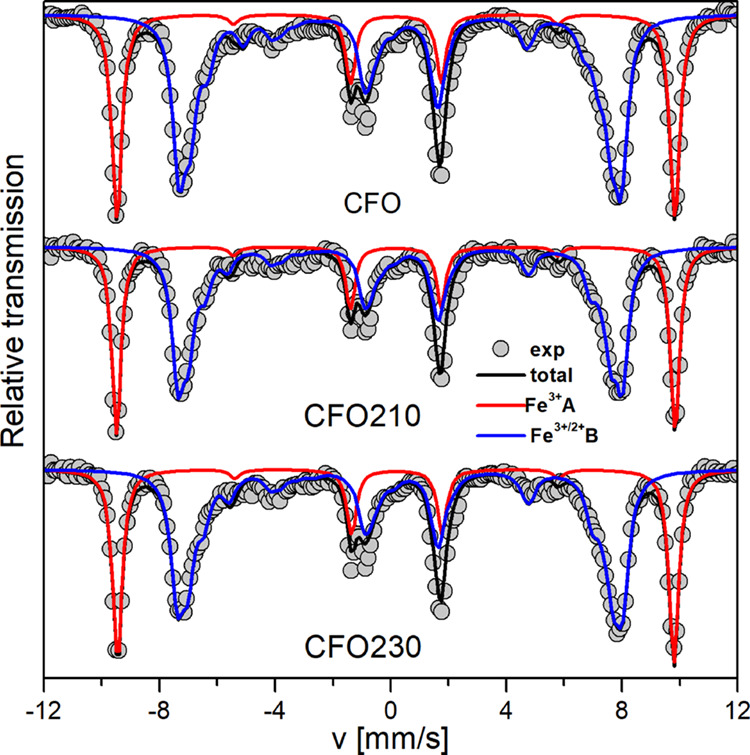
Figure 4.

Mössbauer spectra measured at 12 K under 8 T magnetic field for CFO, CFO210, and CFO320. Gray dots and black solid lines are experimental and simulated total spectrum. Red and blue lines are the simulated sub-spectrum corresponding to A and B sites, respectively. Detailed fit of A and B sites is reported in the Supporting Information (Figure S3).
