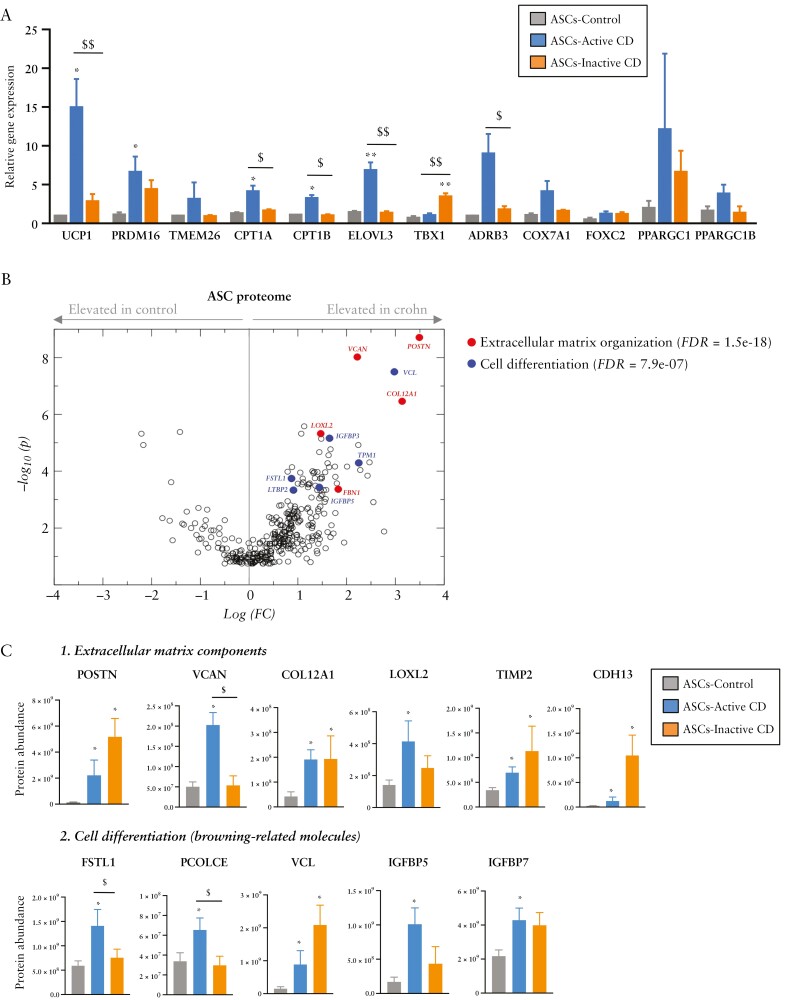
Figure 2.
Adipose stem cells isolated from patients with Crohn’s disease show a brown-like phenotype. [A] Relative gene expression of browning markers in adipose stem cells [ASCs] from visceral adipose tissue [VAT] of patients with active [n = 6] or inactive [n = 6] Crohn’s disease [CD] or from healthy controls [n = 3]. [B, C] Analysis of the ASC protein secretome and protein abundance differences between ASCs of the control group [n = 9] and of the active [n = 9] and inactive [n = 8] CD groups. Shown are examples of enriched pathways [extracellular matrix components and cell differentiation pathways]. Bars in graphs represent mean ± SEM. *p < 0.05 vs control; $p < 0.05 and $$p < 0.01 as indicated in the figure.

