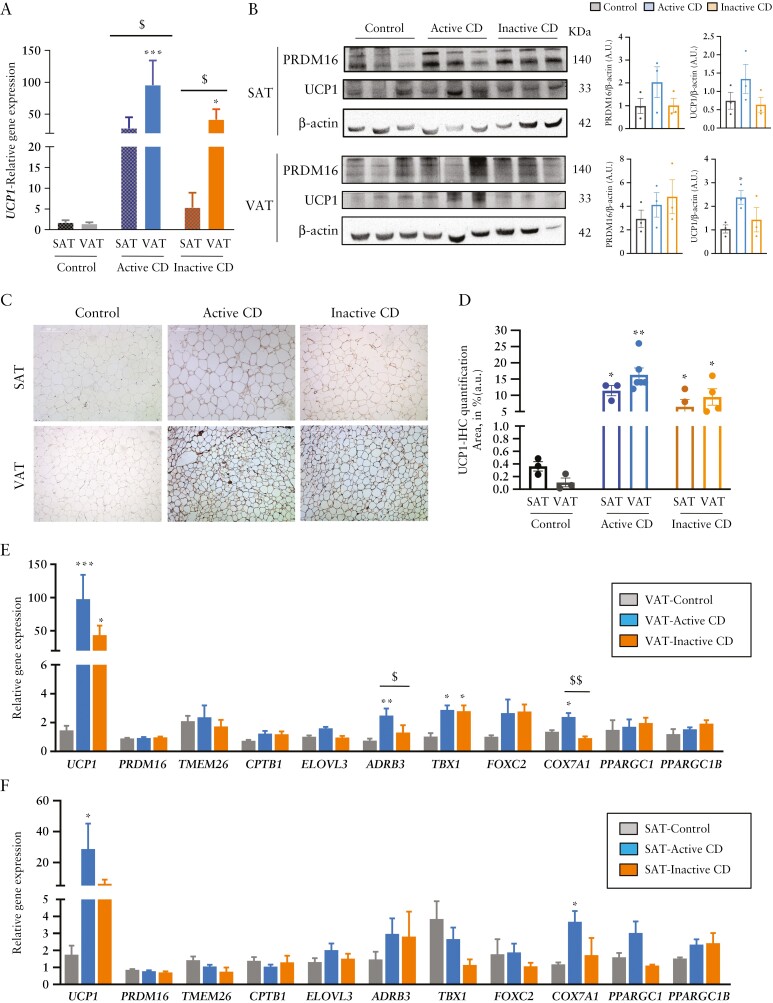
Figure 4.
White-to-beige adipose tissue conversion in the subcutaneous and visceral fat depots of patients with Crohn’s disease. [A] Relative UCP1 gene expression in subcutaneous [SAT] and visceral [VAT] adipose tissue samples of patients with active or inactive disease and in healthy individuals. [B] Western blotting of PRDM16 and UCP1; β actin was used as a loading control. Image and densitometry analysis [a.u., arbitrary units] [n = 3 per group]. All data are shown as mean ± SEM; *p < 0.05 [two-tailed unpaired t-test]. [C] Representative immunohistochemical staining of UCP1 in SAT and VAT tissue sections of the different groups and UCP1 quantification [area in percentage of staining] [n = 3–6 per group]. All data are shown as mean ± SEM; *p < 0.05 [two-tailed unpaired t-test]. Relative gene expression of several browning markers in [D] VAT and [E] SAT in active [n = 9] and inactive [n = 7] disease and in healthy individuals [n = 6]. Bars in graphs represent mean ± SEM. *p < 0.05 vs control; $p < 0.05 and $$p < 0.01 as indicated in the figure.

