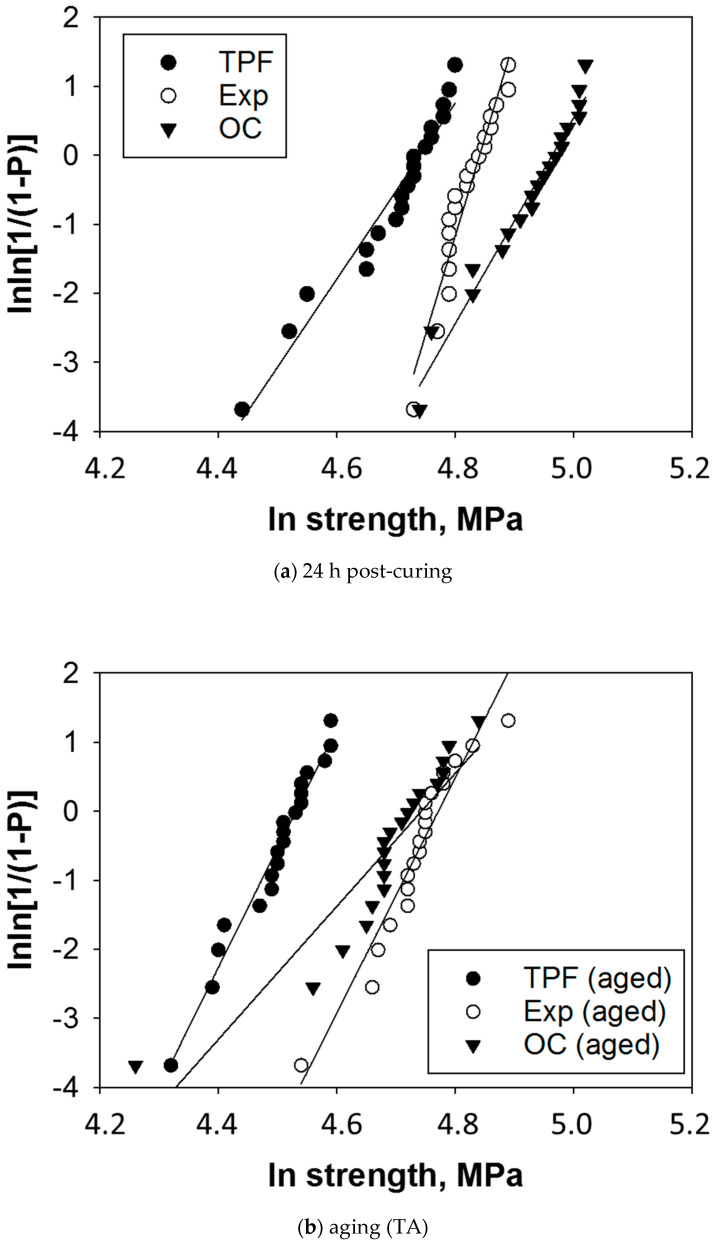
Figure 2.
Weibull plot representing the empirical cumulative distribution function of strength data per material and aging conditions. Linear regression was used to numerically assess the goodness-of-fit and estimate the parameters of the Weibull distribution in (a) 24 h post-irradiated and (b) thermal aged specimens (Table 2).

