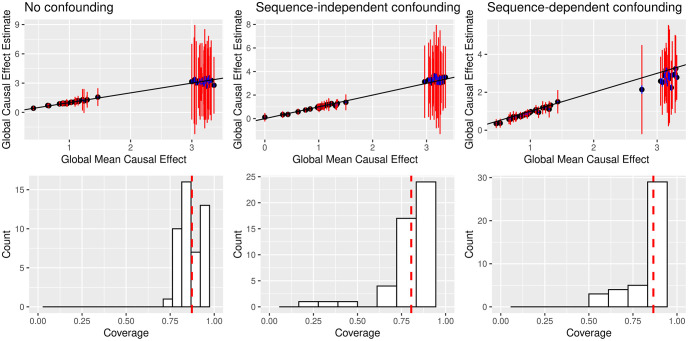
Fig 2. In simulations, DeepMR estimates causal effects between TFs even in the presence of unobserved confounding.
Top row: true vs. estimated global causal effects (CEs) across 50 rounds for unconfounded, random confounded, and sequence-dependent confounded cases respectively. Blue bars denote ±2σ where σ denotes the standard error of the mean and orange bars denote ±2τ where τ denotes the between-region standard deviation. Bottom row: local CE coverage (how often the true CE is in the 95% confidence interval) across the three experiments (same order) with the red line denoting average coverage.

