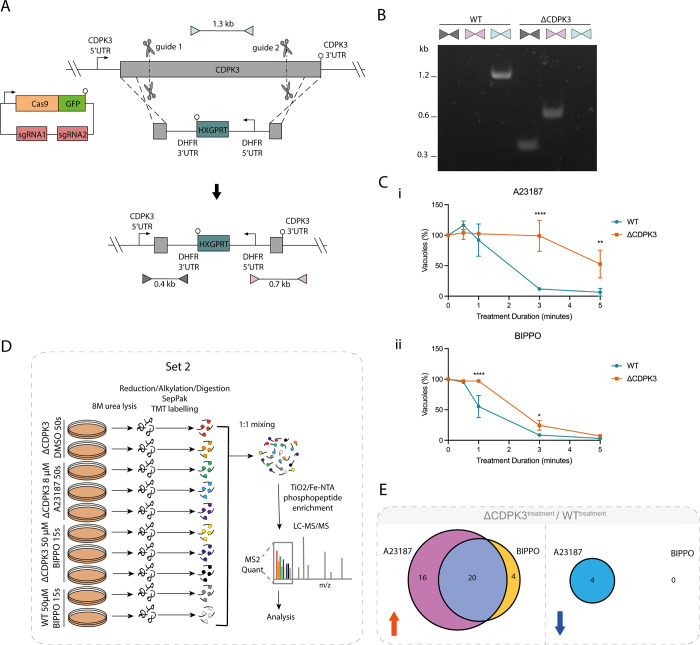
Fig 2.
Comparative phosphoproteomics of BIPPO vs A23187-induced GFP-T2A-jRCaMP1b ΔCDPK3 parasites at peak cytosolic calcium levels (A) Generation of the GFP-T2A-jRCaMP1b ΔCDPK3 line using CRISPR/Cas9 to increase site-directed integration. Scissors represent Cas9 cleavage sites and lollipops depict stop codons. Coloured triangles represent primer pairs used to detect WT, 5’ integration and 3’ integration loci (light blue, grey and pink respectively). (B) PCR results using the primer pairs shown in Fig 2A (C) Egress assay of GFP-T2A-jRCaMP1b (WT) and GFP-T2A-jRCaMP1b ΔCDPK3 (ΔCDPK3) parasites following treatment with (i) 8 μM A23187 or (ii) 50μM BIPPO. Graph shows the remaining % of un-egressed vacuoles (relative to untreated) following A23187/BIPPO treatment. Data are represented as mean ± s.d. (n = 3). Two-way ANOVA with Holm-Sidak post hoc comparison.****, P ≤ 0.0001 (D) Schematic summary of the TMT-10-plex experiment (set 2) and workflow used to quantify the phosphoproteomes of intracellular ΔCDPK3 tachyzoites treated with 50 μM BIPPO (15s), 8 μM A23187 (50s), and WT parasites treated with 50 μM BIPPO (15s). (E) Overlap between differentially regulated phosphosites that display CDPK3 dependency following treatment with 50 μM BIPPO (15s) or 8 μM A23187 (50s) (data derived from set 1 and 2). Red and blue arrows represent up- and down-regulated sites, respectively. Only phosphosites found to be differentially regulated upon treatment with both A23187 and BIPPO were included for analysis.

