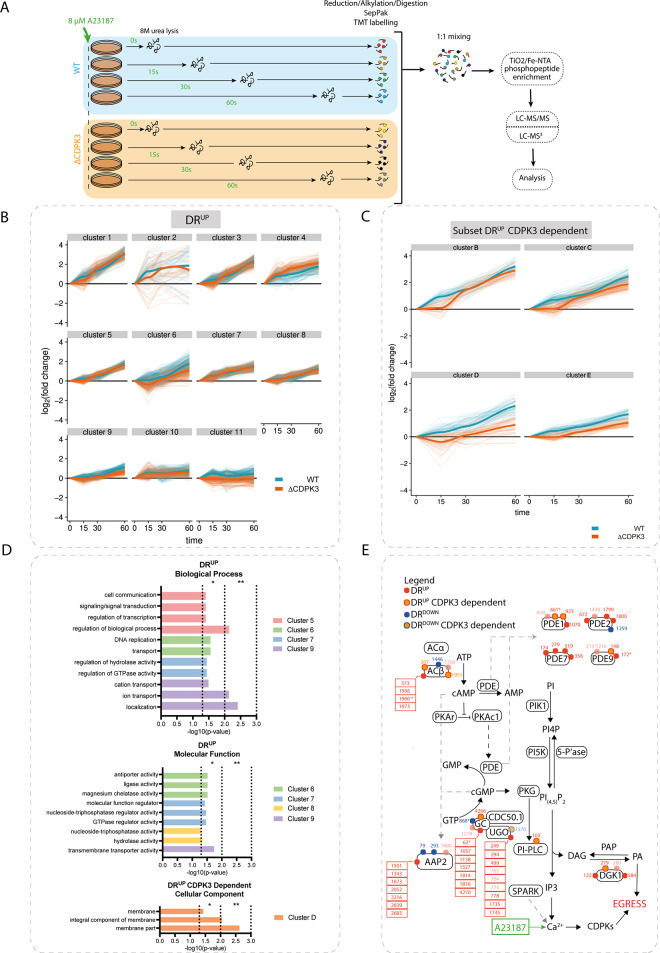
Fig 3.
A23187 treatment results in partially CDPK3-dependent phosphorylation of targets implicated in PKG signalling (A) Schematic of A23187-treatment timecourse experimental design. (B) Gaussian mixture-model-based clustering of all DRUP sites in the A23187-treatment timecourses. Log2FC values from both WT and ΔCDPK3 samples were combined to cluster on six dimensions (WT 15s, 30s and 60s and ΔCDPK3 15s, 30s and 60s). Thin lines represent the timecourse traces of individual phosphorylation sites. Thick lines represent Loess regression fits of all traces. (C) Gaussian mixture-model-based clustering of a subset of DRUP CDPK3-dependent sites in the A23187-treatment timecourses. Log2FC values from both WT and ΔCDPK3 samples were combined to cluster on six dimensions (WT 15s, 30s and 60s and ΔCDPK3 15s, 30s and 60s). Thin lines represent the timecourse traces of individual phosphorylation sites. Thick lines represent Loess regression fits of all traces. Four clusters (B-E) best illustrating the transient phosphorylation delay in ΔCDPK3 parasites are shown. (D) GO term enrichment analysis showing a subset of terms in the DRUP and DRUP CDPK3-dependent clusters. (E) Differentially A23187-regulated phosphosites detected on targets implicated in the regulation of PKG signalling. Red and blue dots represent sites that are differentially up- or down-regulated, respectively. Dots with an orange centre indicate CDPK3-dependent sites. Numbers refer to site position within protein. Dots with reduced opacity represent phosphorylation sites with lower confidence in the phosphorylation site assignment. Asterisks highlight sites that were previously detected in this study’s A23187/BIPPO phosphoproteome experiments (see Figs 1D and 2D).

