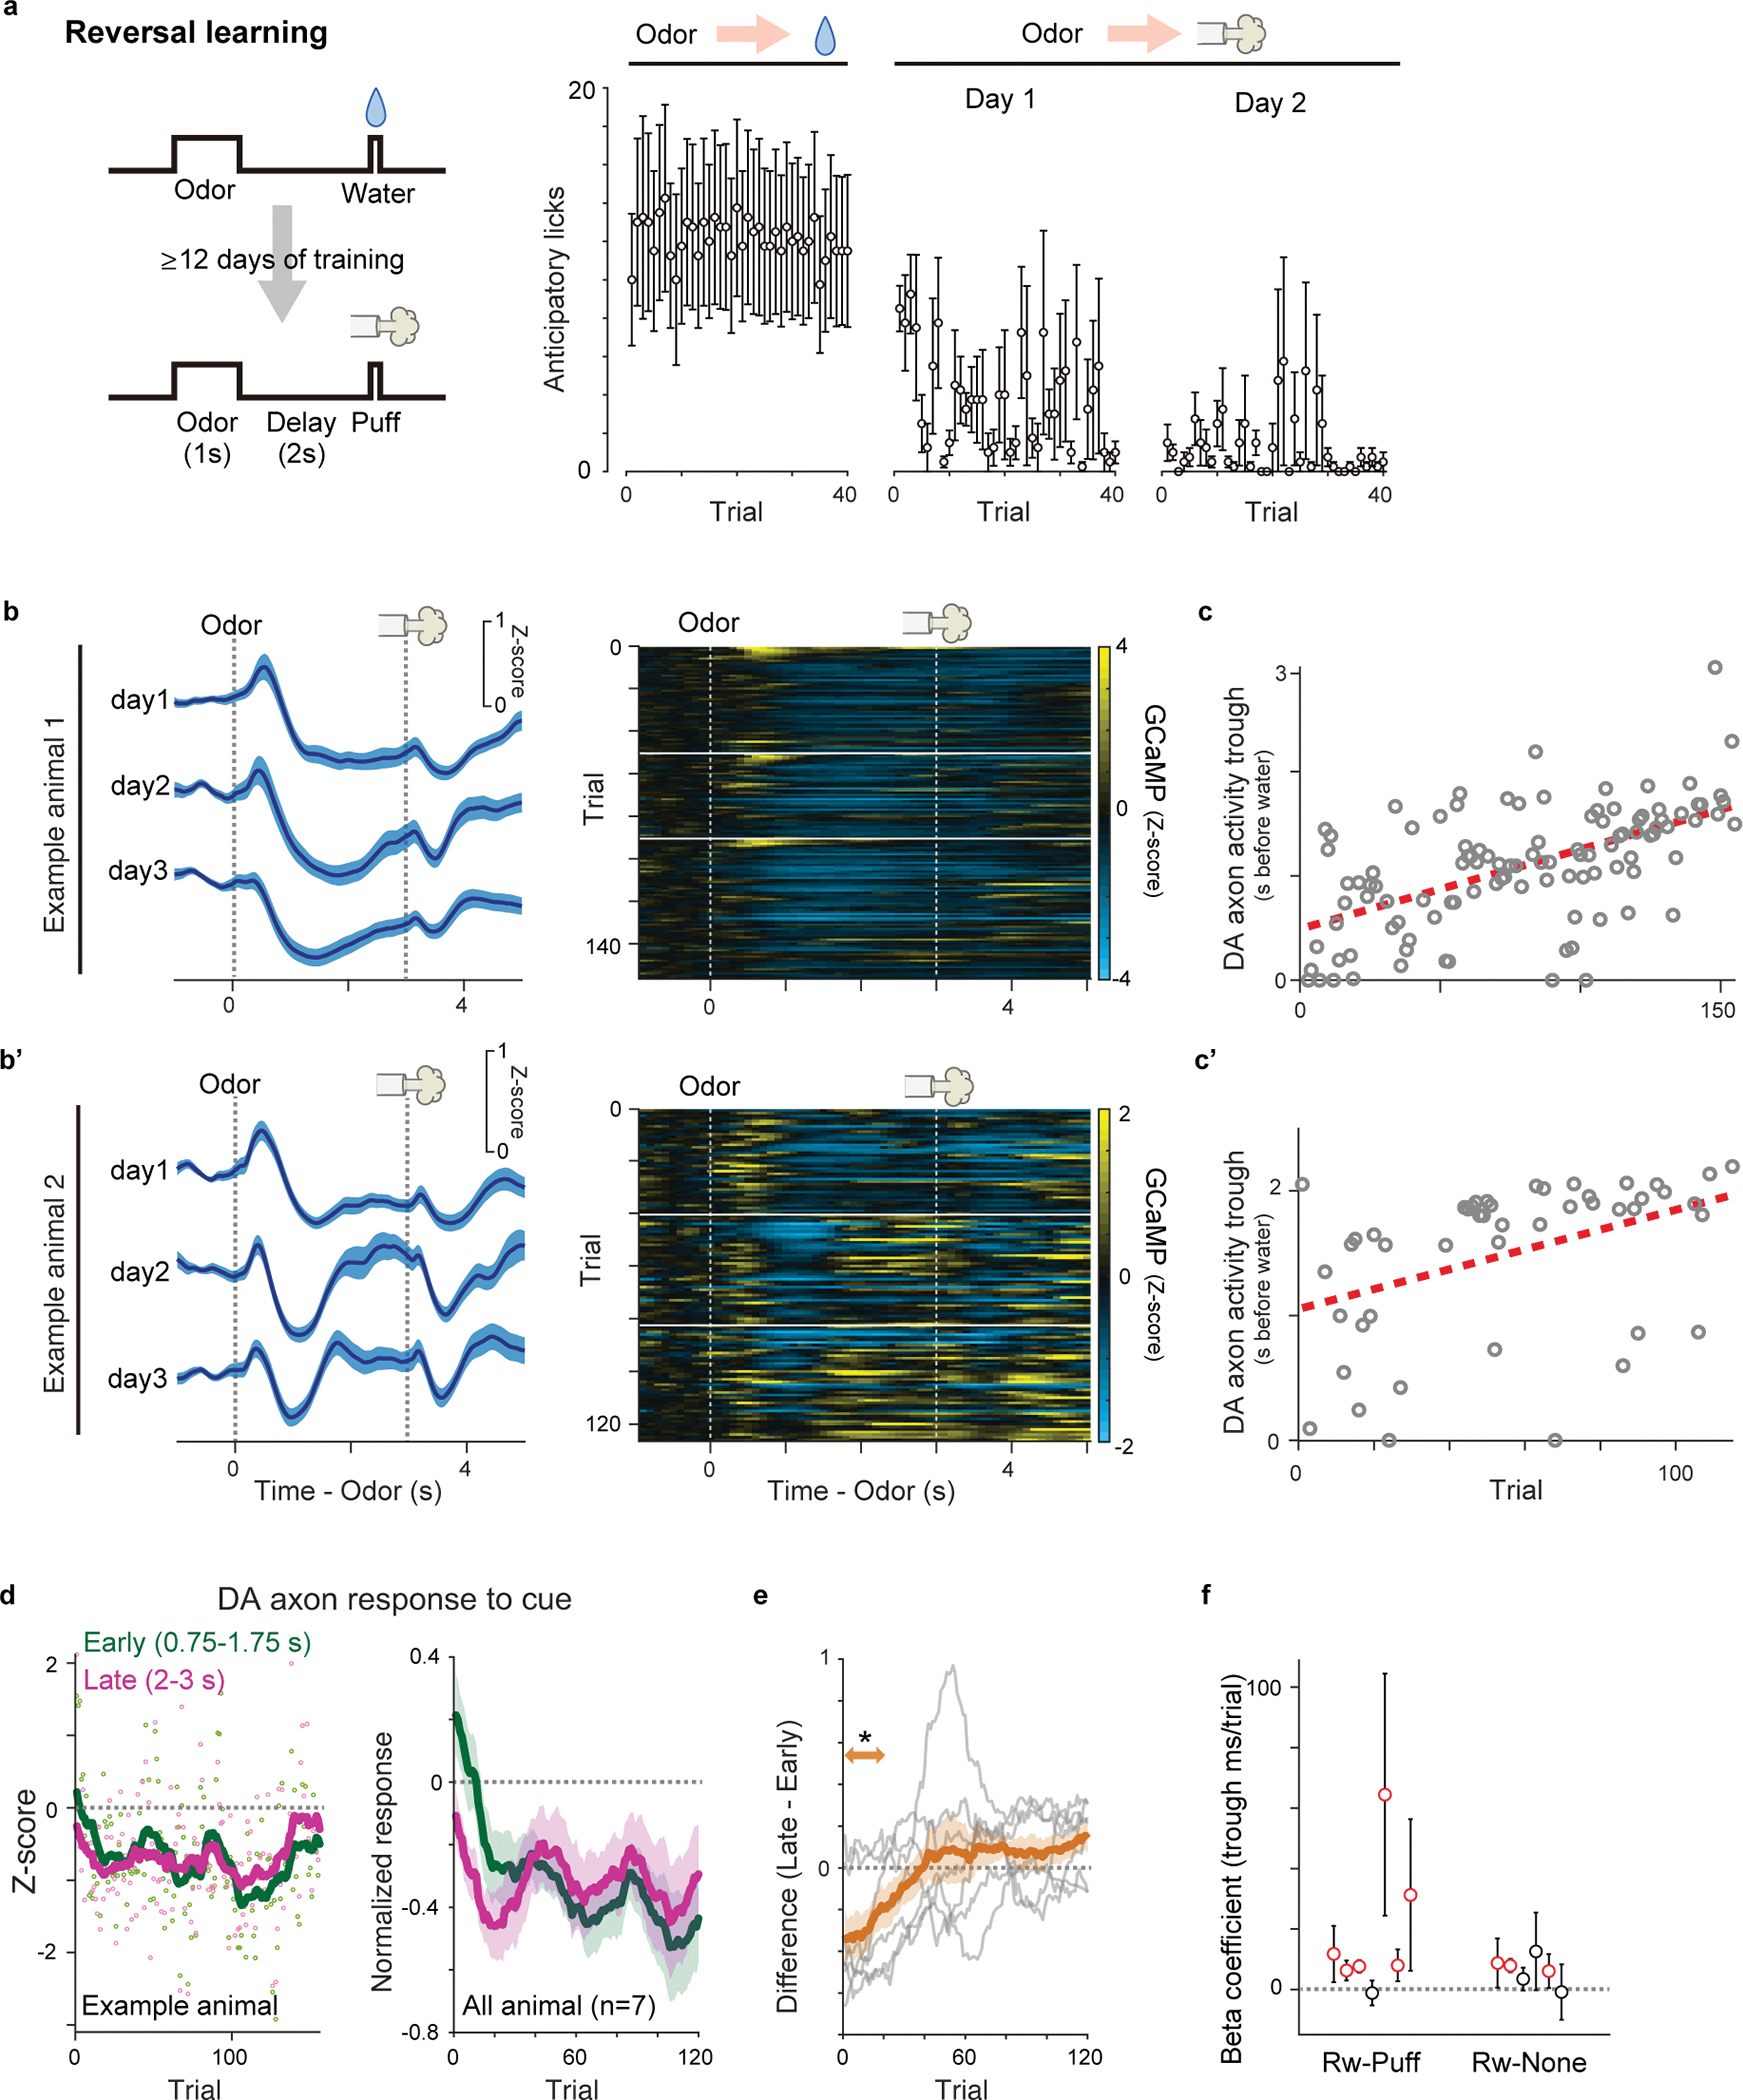
Extended Data Fig. 7. Temporal shift of dopamine inhibitory activity in reversal learning.

(a) Lick counts during the delay period (0–3 s after odor onset) in reversal training from reward to airpuff (n = 7 animals). Mean ± sem for each trial. (b and b’) GCaMP signals from example animals during reversal. Left, session mean ± sem. The white horizontal lines (top) show session boundaries. (c and c’) Dopamine activity trough (gray circle) and linear regression with trial number ((c) regression coefficient 7.6 ms/trial, p = 5.9 × 10⁻¹³: (c’) regression coefficient 7.9 ms/trial, p = 3.8 × 10⁻³). (d) Responses to the airpuff-predicting odor in an example animal (left) and in all animals (right, mean ± sem). Early: 0.75–1.75 s from odor onset (green). First 0.75 s was excluded to minimize contamination of remaining positive cue response. Late: 2–3 s from odor onset (magenta). (e) Difference between early and late odor responses (grey: each animal; orange: mean ± sem). Dopamine activity in the late phase was significantly higher than activity in the early phase during the first 2–20 trials (t = −3.0, p = 2.3 × 10⁻³; two-sided t-test). (f) Regression coefficient ±95% confidence intervals between activity peak and trial number in each animal in different experimental conditions (mean ± 95% confidence intervals). Red circles, significant (p ≤ 0.05; F-test, no adjustment for multiple comparison) slopes. n = 7 animals for each condition. Data of one animal in reversal from reward to nothing was removed because of insufficient number of trials with detected troughs. *p<0.05.
