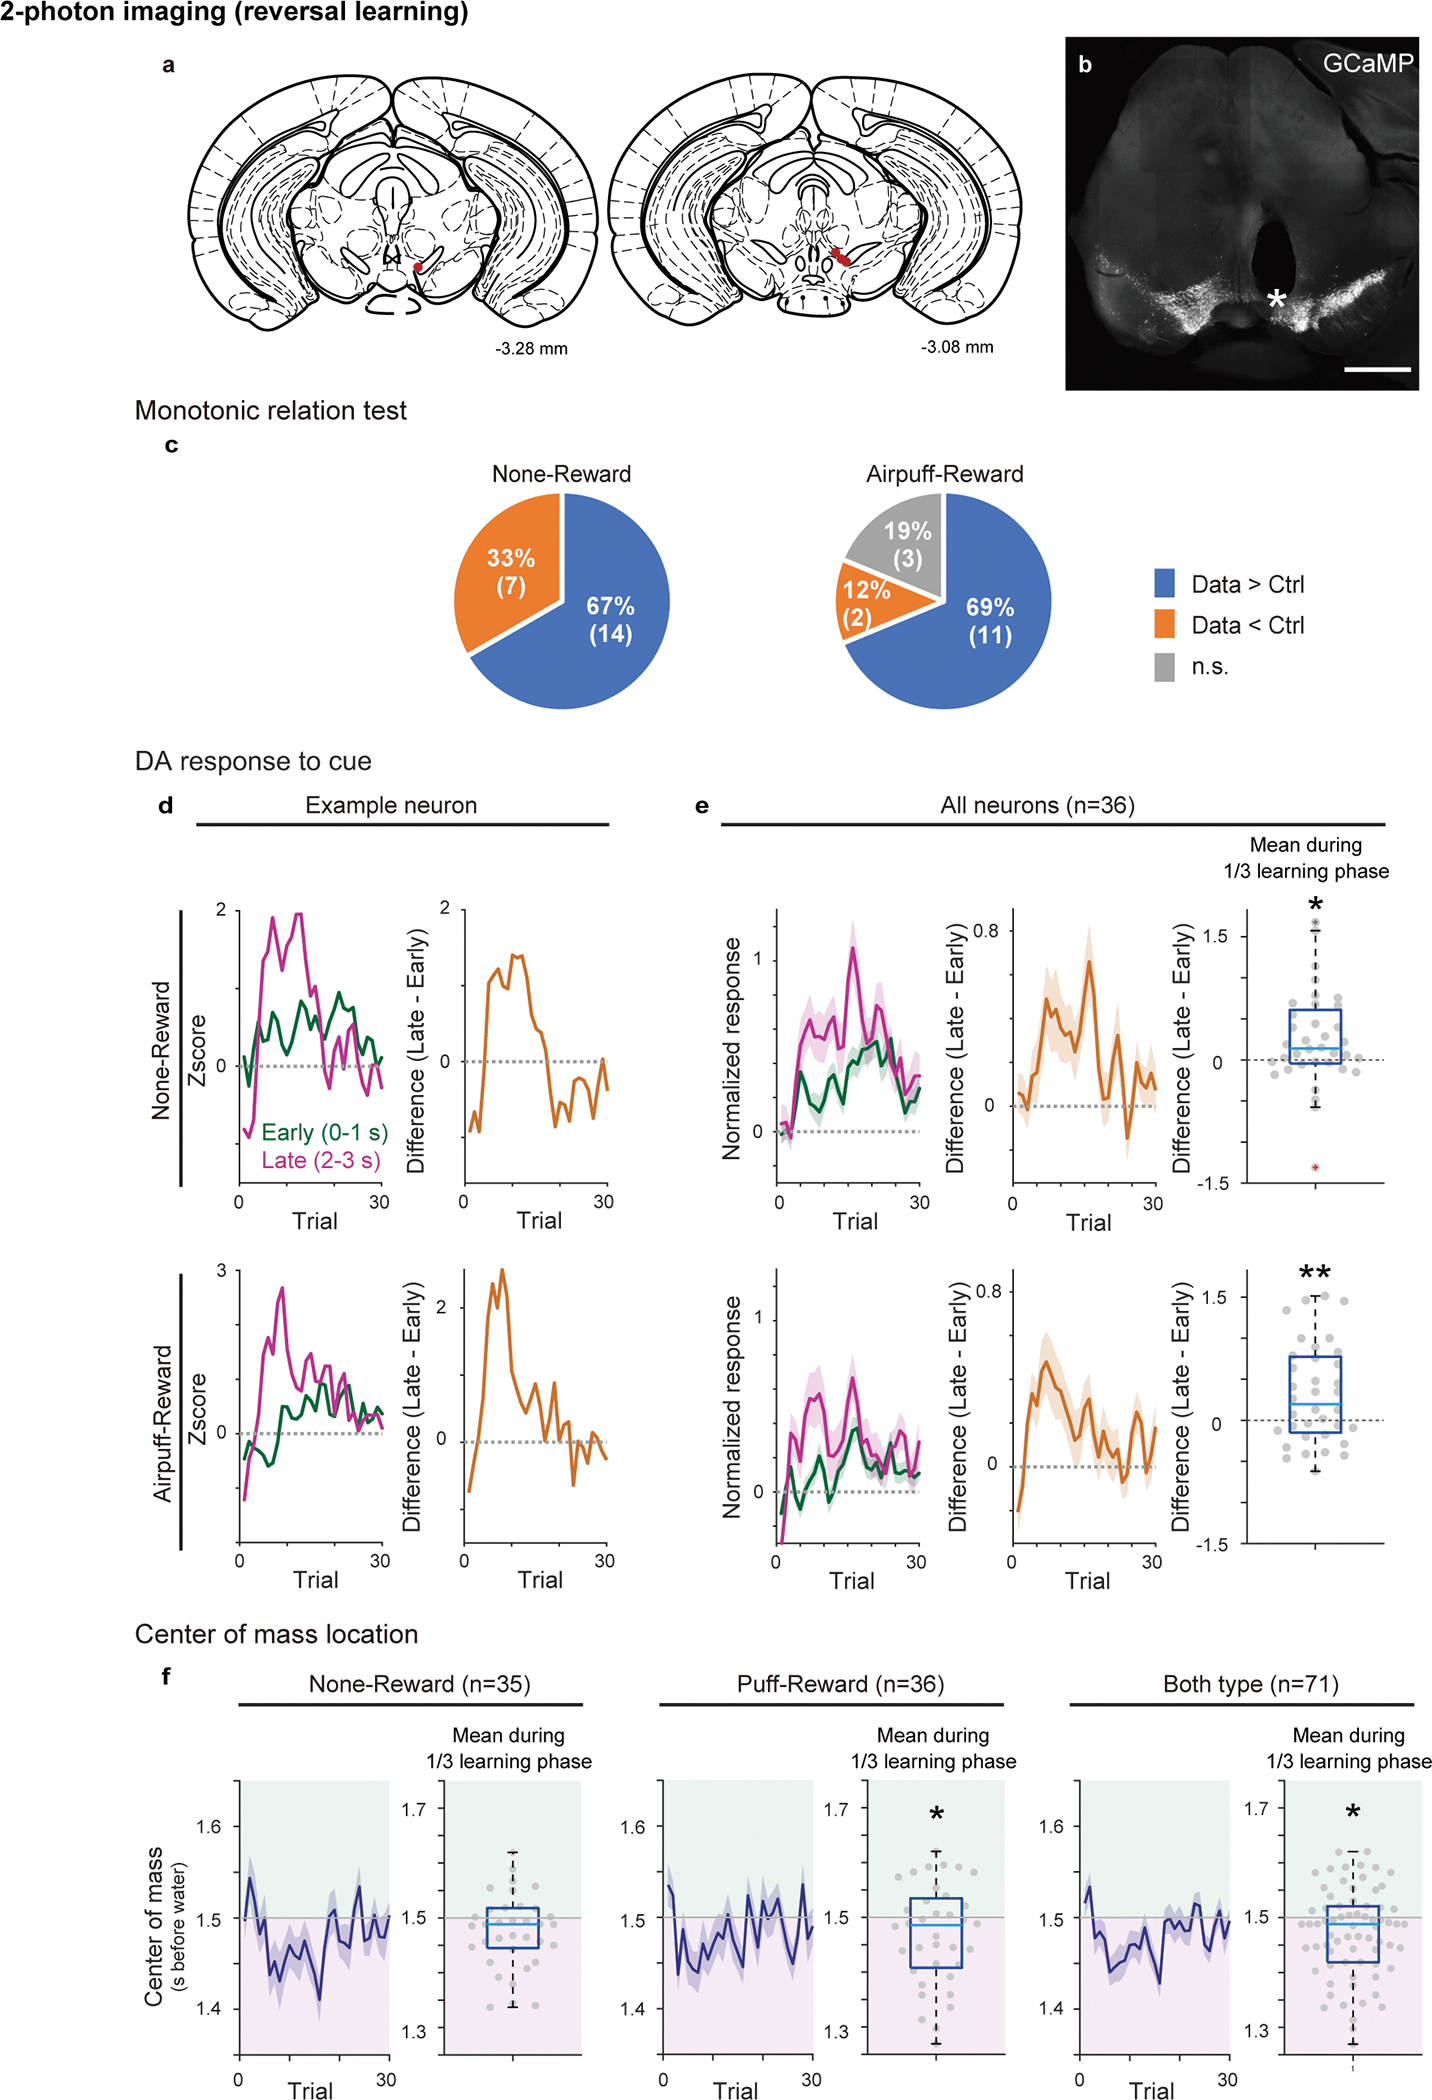
Extended Data Fig. 10. Recording sites and dopamine cue responses in deep 2-photon imaging.

(a) Recording site for each animal is shown in coronal views (Paxinos and Franklin61). (b) Example coronal section of a recording site and GCaMP expression in the VTA. An asterisk indicates fiber tip location. Other 4 animal also showed similar result as shown in (a). Scale bar, 1 mm. (c) Probability of monotonic shift in randomly sampled 3 activity peaks in actual data (blue) and control (red). The neurons with sufficient detected peaks were used (21/36 neurons for nothing to reward, 16/36 neurons for airpuff to reward, see Methods). Sampling was repeated for 500 times for each neuron. The pi-chart summarizes the number of neurons with significantly higher probability of monotonic shift (p<0.05; two-sided t-test, no adjustment for multiple comparison, Data > Ctrl; blue), significantly lower probability of monotonic shift (p<0.05; two-sided t-test, no adjustment for multiple comparison, Data < Ctrl; orange), and not significantly different (n.s.; two-sided t-test, no adjustment for multiple comparison; gray) compared to control (left, nothing to reward, p = 0.039; right, airpuff to reward, p = 0.038, binomial cumulative function). (d and e) Responses to a reward-predicting odor in an example neuron (left column of b) and all neurons (left column of c, n=36, mean ± sem). early: 0–1 s from odor onset (green); late: 2–3 s from odor onset (magenta). Right column of b and middle column of c, difference between early and late odor responses (mean ± sem for c). Right column of c, dopamine activity in the late phase was significantly higher than activity in the early phase during the first 1/3 of learning phase for nothing to reward (t = 2.5, p = 0.015; two-sided t-test), and airpuff to reward (t = 3.1, p = 0.35× 10⁻²; two-sided t-test). (f) Time-course of center of mass (0–3s after cue onset) over training and average centers of mass during the first 1/3 learning phase in all neurons used for linear fitting analysis (left, nothing to reward, n = 35, t = −1.0, p = 0.30; middle, airpuff to reward, n = 36, t = −2.0, p = 0.048; right, both types are pooled, t = −2.2, p = 0.030; two-sided t-test). Center of boxplot showing median, edges are 25th and 75th percentile, and whiskers are most extreme data points not considered as outlier. *p<0.05, **p<0.01.
