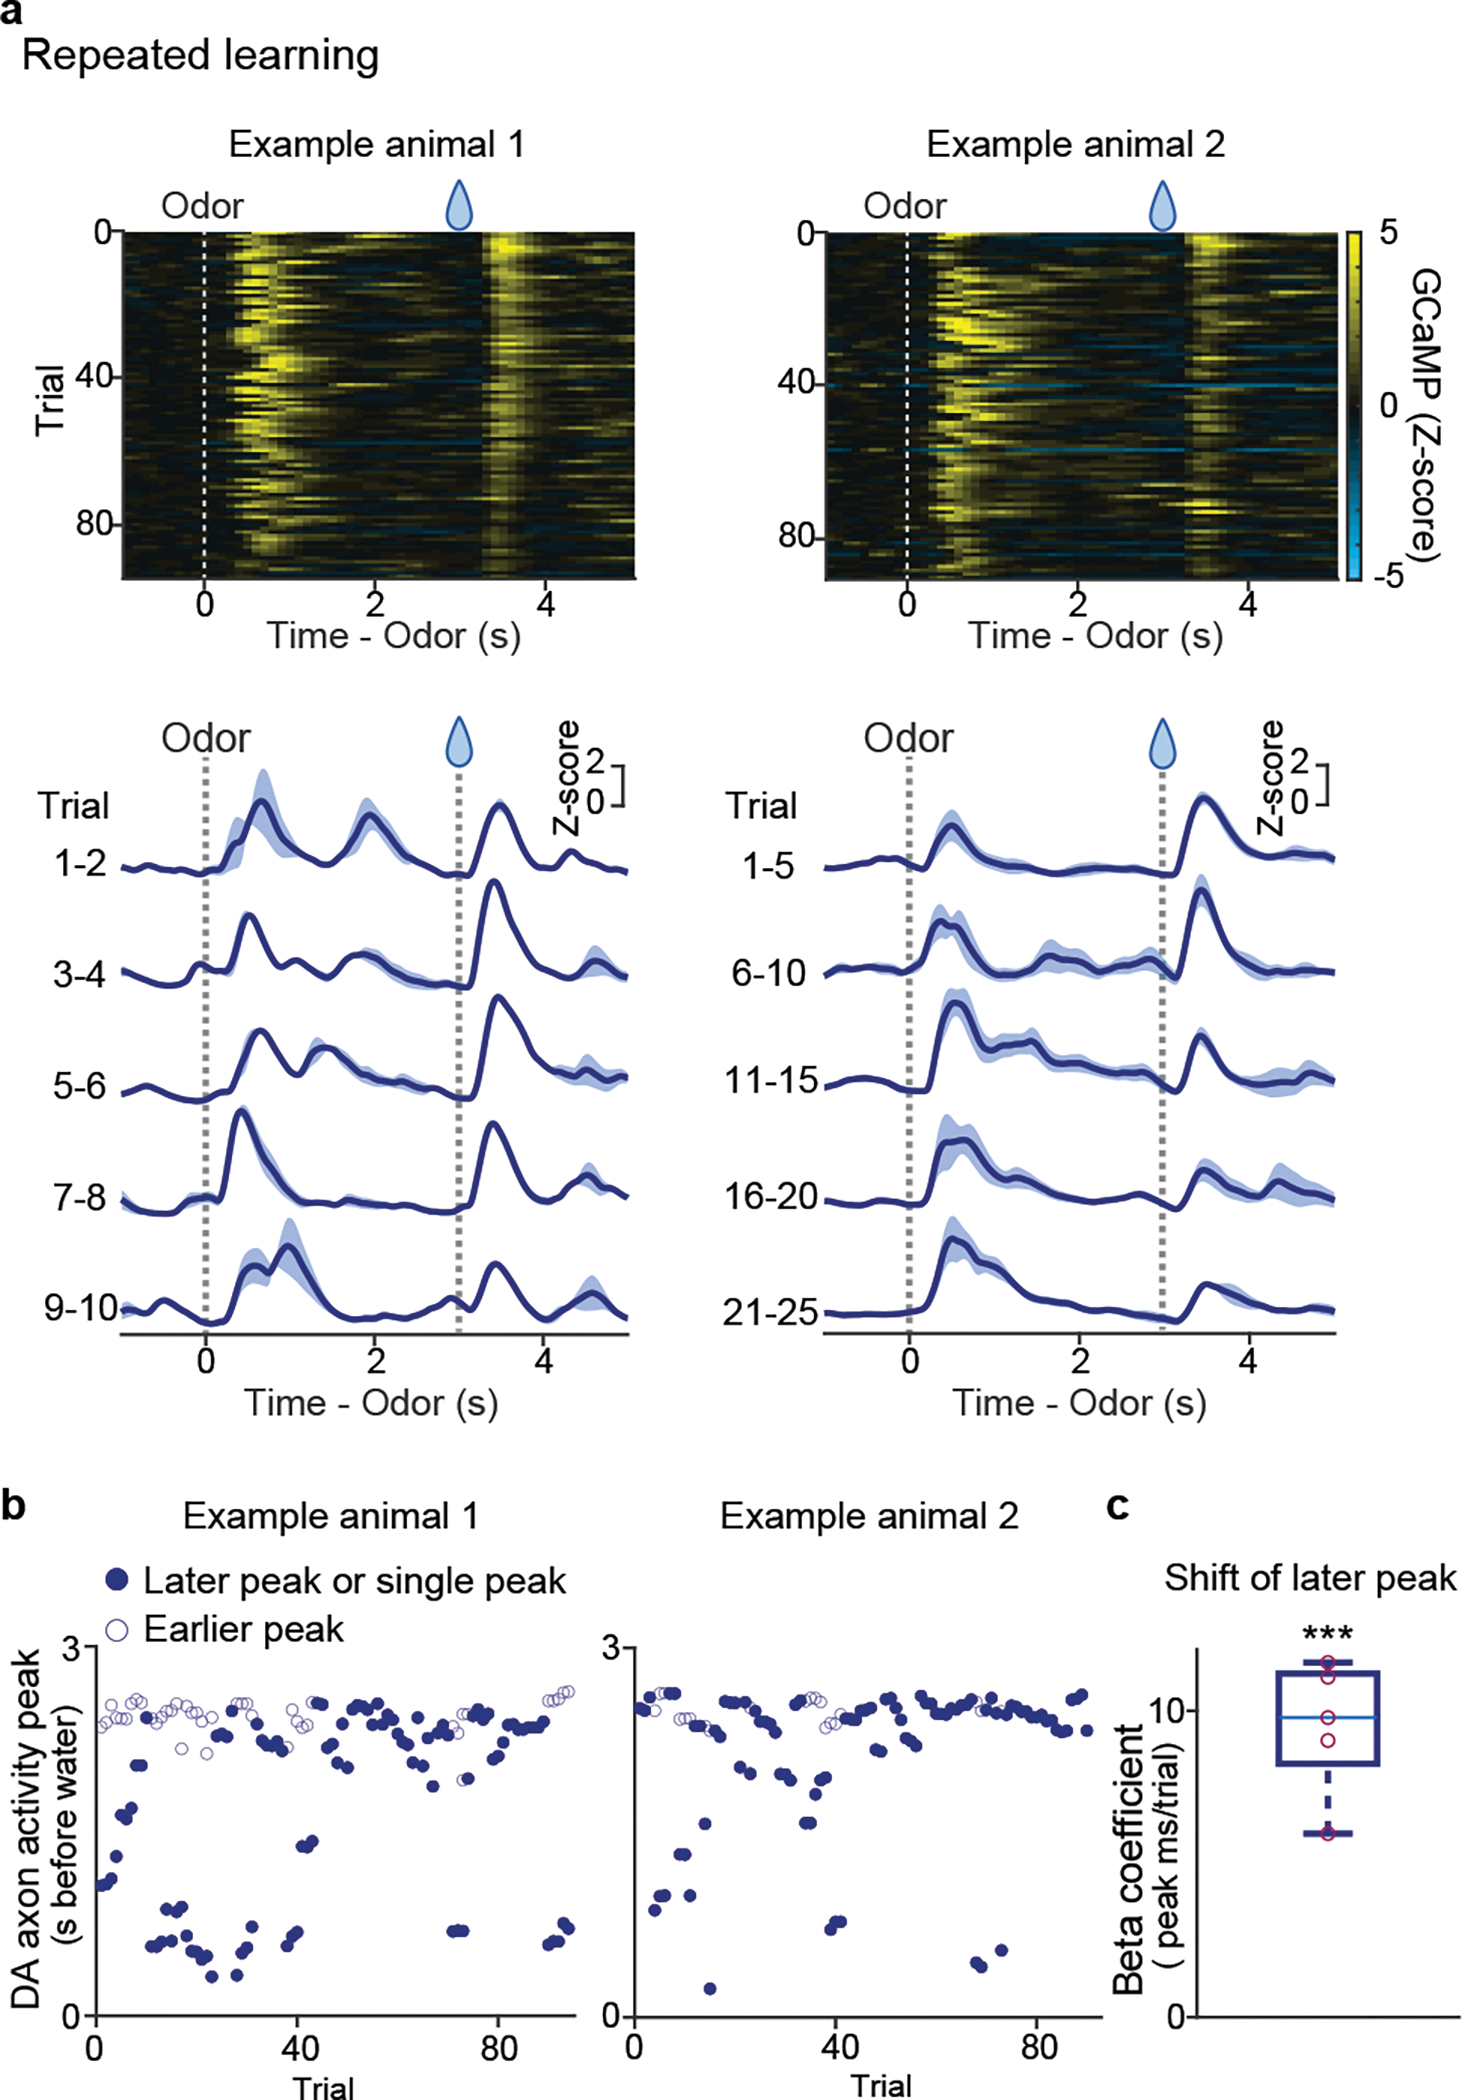
Figure 4. Dopamine axon activity in repeated associative learning.

(a) GCaMP activity in odor-reward association trials in 2 example animals. Bottom, mean ± sem. (b) GCaMP activity peaks (up to 2 for each trial) in the same animals. Filled circles represent the 2nd peak (or peak in trials with only one). (c) Linear regression coefficients for 2nd peak timing with trial number (n = 5 animals; t = 9.6, p = 0.65 × 10⁻³; two-sided t-test). Red circles, significant (p-value ≤ 0.05, F-test). Center of boxplot showing median, edges are 25th and 75th percentile, and whiskers are most extreme data points. ***p<0.001
