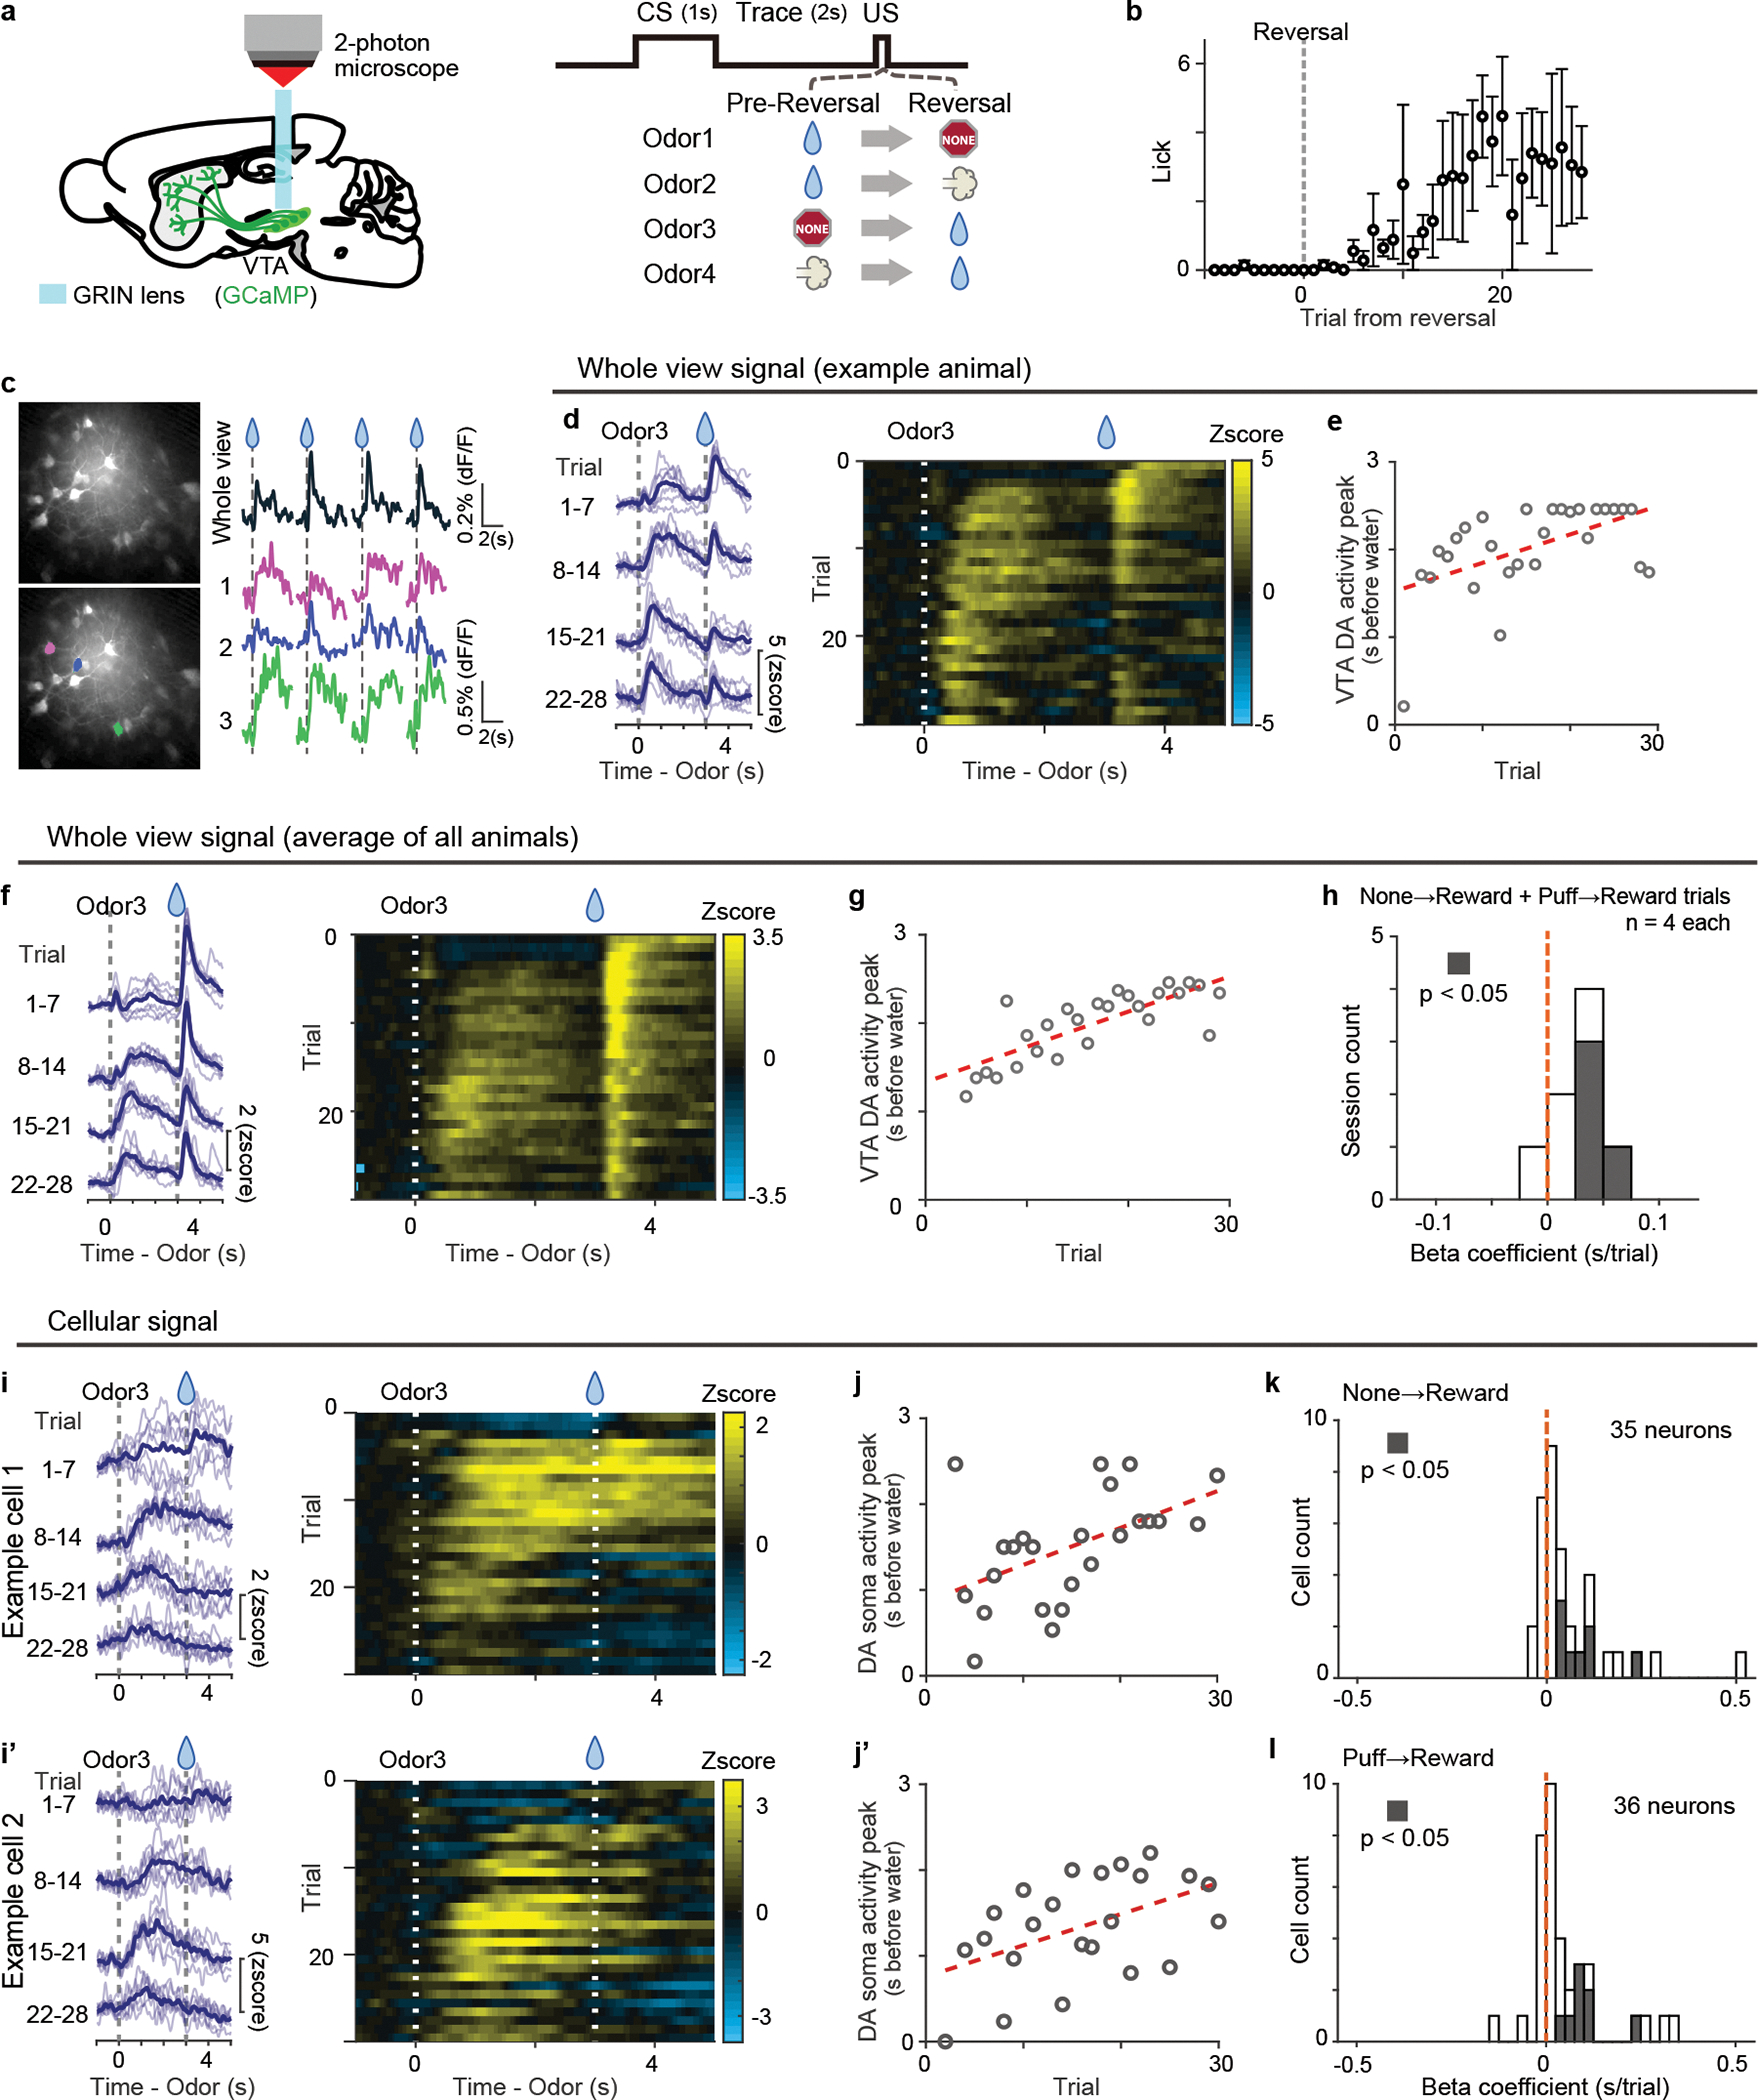
Figure 5. 2-photon imaging of dopamine activity in reversal learning.

(a) Either GCaMP6f or GCaMP7s was expressed in the VTA dopamine neurons, and GRIN lens was targeted to the VTA. (b) Lick counts during the delay period (0–3 s after odor onset) with reversal training from nothing to reward (n = 4 animals). Mean ± sem for each trial. (c) Example GCaMP responses to unexpected water (every 3 trials) in a whole field of view (right top) and in 3 example cells (right bottom 3), marked with color (left bottom). (d) GCaMP signals in reversal trials in a whole field of view in an example animal. Left, each blue line shows 7 trials mean activity (light blue: each trial). (e) Dopamine activity peak (gray circle) and linear regression with trial number (regression coefficient 32 ms/trial, p = 4.2 × 10⁻³; F-test). (f) Average GCaMP signals in reversal trials in a whole field of view (n = 4 animals). Left, each blue line shows 7 trials mean activity (light blue: each trial). (g) Dopamine activity peak (gray circle) and linear regression with trial number (regression coefficient 39 ms/trial, p = 2.1 × 10⁻⁸; F-test). (h) Histogram for linear regression coefficients. Both reversals (from nothing to reward and from airpuff to reward) are pooled (n = 4 animals each). Gray bars show significant (p-value ≤ 0.05; F-test, no adjustment for multiple comparison) correlation. (i and i’) GCaMP signals in cell bodies of example neurons in VTA. Left, each blue line shows 7 trials mean activity (light blue: each trial). Right, heatmap for a session. (j and j’) Dopamine activity peak (gray circle) and linear regression with trial number ((j) regression coefficient 45 ms/trial, p = 6.5 × 10⁻³: (j’); regression coefficient 38 ms/trial, p = 1.3 × 10⁻²; F-test). (k and l) Histogram for regression coefficients for reversal from nothing to reward (k, n = 35 neurons from 4 animals) and for reversal from airpuff to reward (l, n = 36 neurons from 4 animals). Gray bars, significant slopes (p-value ≤ 0.05; F-test, no adjustment for multiple comparison).
