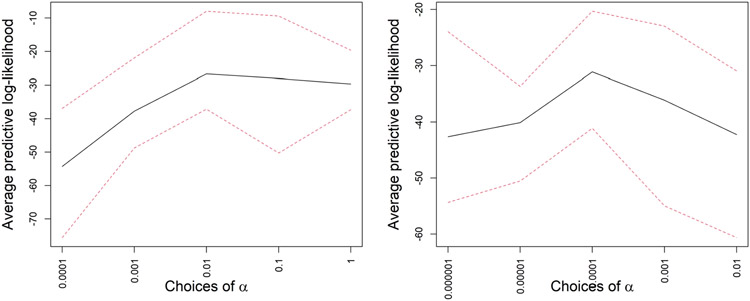
Fig. 7.
Average predictive log-likelihoods in black along with two dotted red lines, denoting the range of predictive log-likelihoods across all the splits for different choices of α in simulation Case 2 for two cases—in the first case the perturbation matrices are generated using true α0 = 10−2, and in the second case α0 = 10−4. This is based on the simulation experiment of Figure 5.

