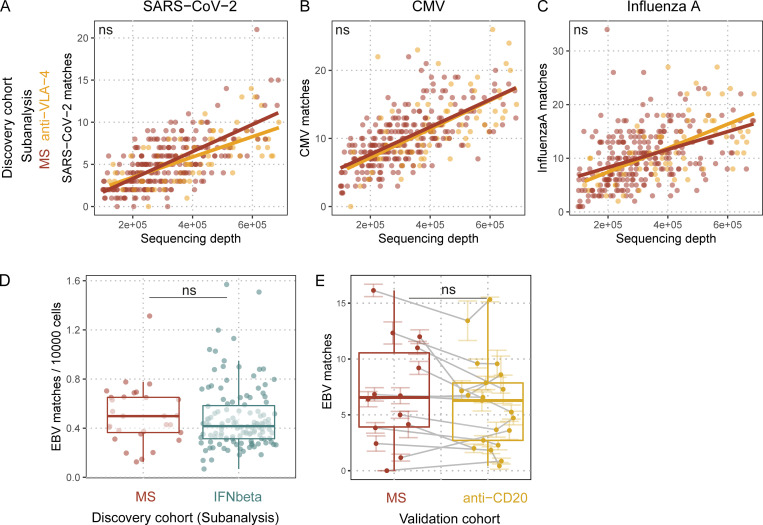
Figure S3.
Quantification of pathogen-specific TCRβ sequences in TCRβ repertoires with regard to MS treatments. (A–C) SARS-CoV-2 (A), CMV (B), and influenza A (C). TCRβ sequence matches quantified in untreated MS patients (red dots and line) and anti-VLA-4–treated MS patients (orange dots and line) against sequencing depth (number of productive templates in the sample; SARS-CoV-2:qanti-VLA-4 = 0.41808; CMV:qanti-VLA-4 = 1; influenza A:qanti-VLA-4 = 1; nMS = 248; nanti-VLA-4 = 73); lines indicate linear regressions; q values indicate adjusted significance of treatment in linear models with the covariates sequencing depth, age, sex, and HLA. (D) EBV TCRβ sequence matches quantified in treatment-naive MS patients (red dots) and MS patients only treated with IFNβ (cyan dots; qIFNbeta = 1; nMS = 29; nIFNbeta = 123); q values indicate adjusted significance of treatment in linear models with the covariates sequencing depth, age, sex, and HLA. (E) EBV TCRβ sequence matches quantified in MS patients before their anti-CD20 treatment (red dots), and after their anti-CD20 treatment (yellow dots; qanti-CD20 = 0.068; nMS = 14; nanti-CD20 = 14). Colored lines indicate standard error of the mean of the sequencing pools for the respective sample; gray lines connect samples from the same individual. q values indicate adjusted significance of anti-CD20 treatment in linear mixed models with the covariates sequencing depth, age, sex, treatment, and sequencing pools nested within samples within individuals.

