Figure 3.

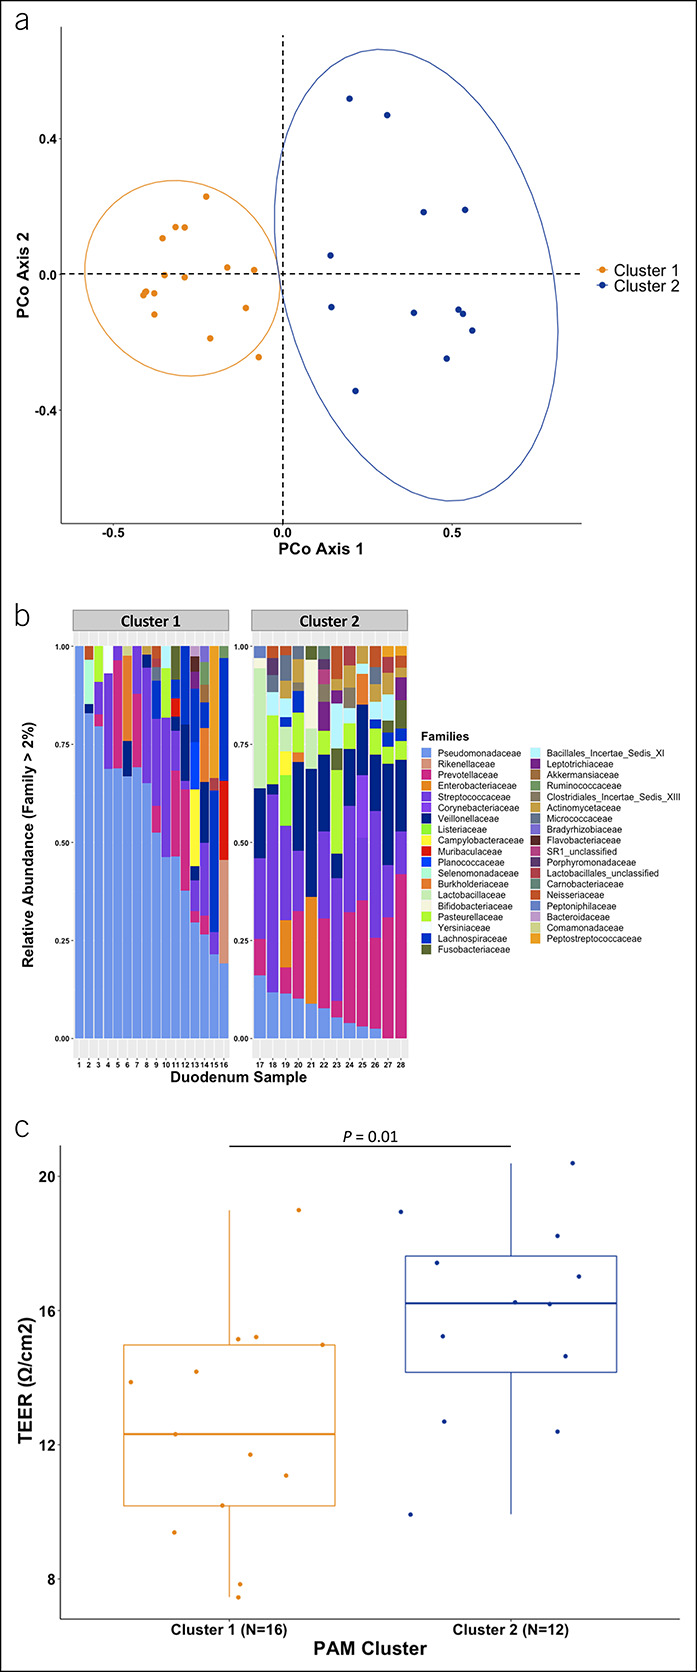
Duodenal mucosal microbiome enterotypes vary by epithelial permeability in the combined cohort of patients with cirrhosis and controls. (a) PCoA of θYC distances comparing duodenal mucosal microbiota in cluster 1 with cluster 2 enterotypes. (b) Comparison of relative abundance of families (those with >2% abundance) between cluster 1 and 2 enterotypes. (c) Duodenal transepithelial electrical resistance between those with a cluster 1 vs cluster 2 enterotype. PCoA, principal coordinate analysis.
