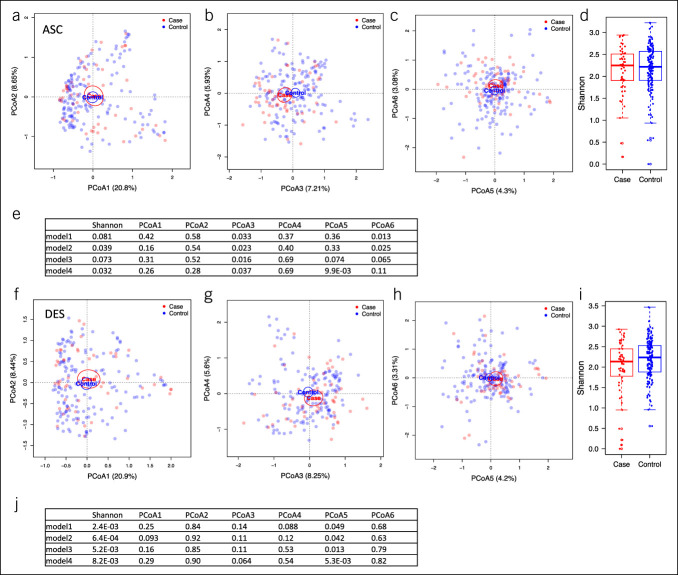
Figure 1.
PCoA plots and alpha diversity of the ASC and DES colon microbiomes of study participants. (a–c) PCoA plots of the case and control microbiomes in the ASC microbiome showing PCoA 1–2 (a), 3–4 (b) and 5–6 (c). (d) Boxplots of the Shannon diversity of cases and controls in the ASC microbiome. (e) P values of linear regression models analyzing the associations between case/control and Shannon diversity, PCoA1–6 adjusted for covariates (see Methods) in the ASC microbiome. (f–h) PCoA plots of case and control microbiomes in the DES microbiome. (i) Boxplots of the Shannon diversity of cases and controls for the DES microbiome. (j) The P values of linear regression models analyzing the associations between case/control and Shannon index, PCoA1–6 adjusted for covariates (see Methods) in the DES microbiome. The ellipses in PCoA plots indicate 95% confidence limits. The boxplots showed the median and 25th and 75th percentiles. ASC, ascending; DES, descending; PCoA, principal coordinate analysis.

