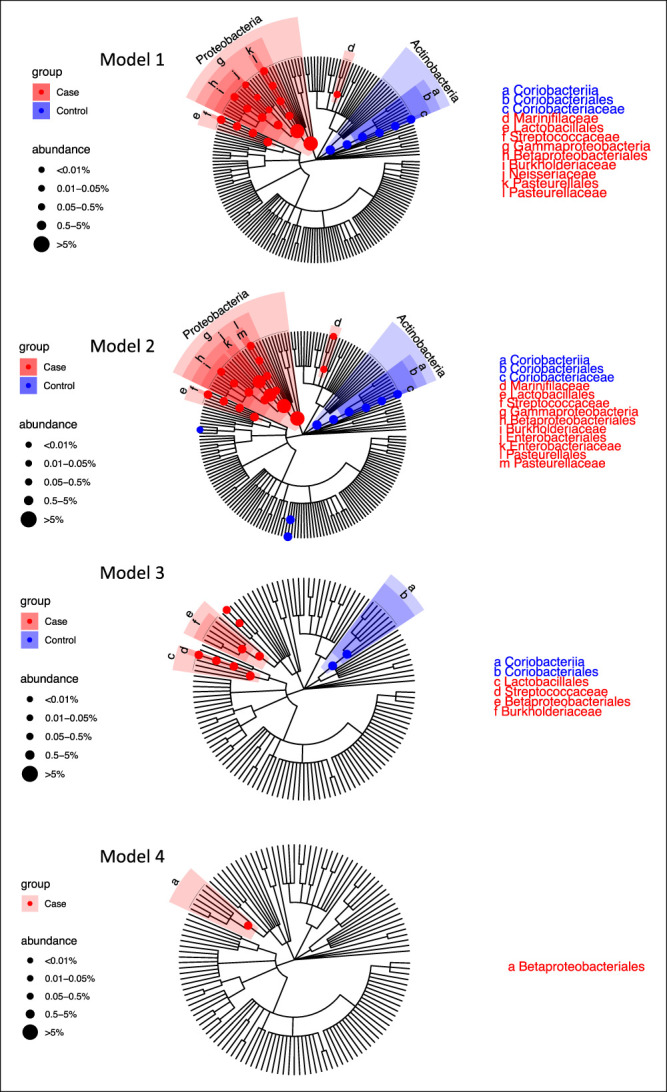
Figure 2.

Significant differential taxa between microscopic colitis cases and controls highlighted in the taxonomic tree of the DES colon microbiome for the 4 linear regression models. Model 1 is adjusted for batch, education, and PPI use. Model 2 is additionally adjusted for sex and antibiotics. Model 3 is adjusted for age along with the covariates in model 2. Model 4 is adjusted for BMI along with the covariates in model 3. The branches of significant taxa from phylum to family level were highlighted and labeled. The node sizes are proportional to the overall relative abundance of the taxa. BMI, body mass index; DES, descending; PPI, proton pump inhibitor.
