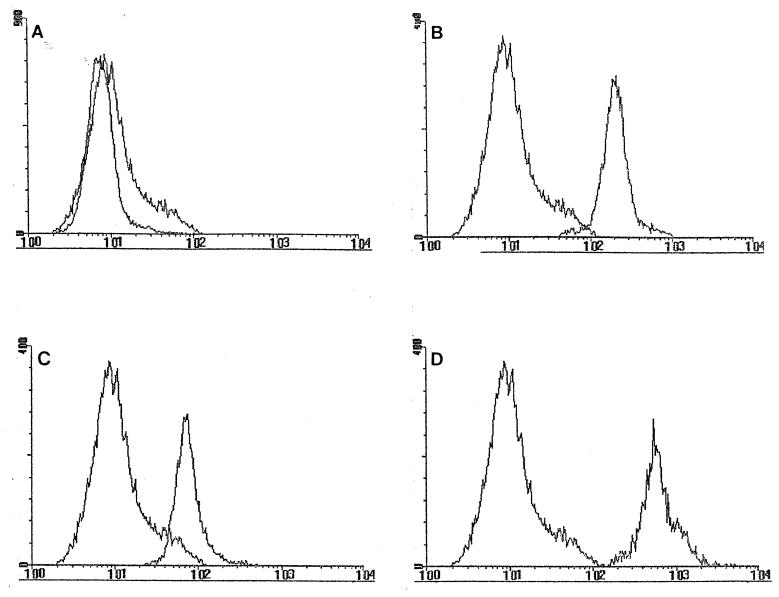
FIG. 1.
Expression of uPAR by peripheral blood monocytes. (A) The fluorescence-activated cell sorter histograms indicate that healthy controls express very low levels of uPAR. (B) Treatment with LPS significantly increased both the percentage of uPAR+ monocytes and the MLFI. (C) RRMS patients express variable levels of uPAR, although the expressed uPAR at higher level than the controls did. (D) SPMS patients express uniformly high levels of uPAR compared to the levels expressed by healthy controls.

