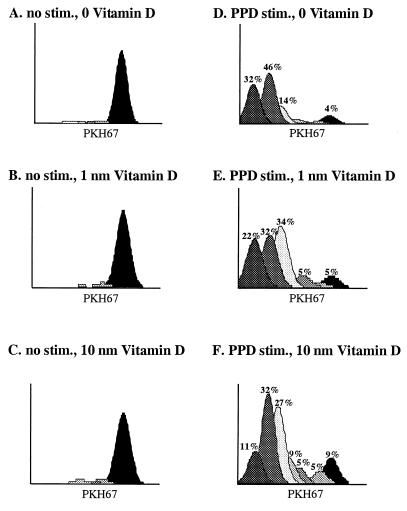
FIG. 1.
Addition of 1,25(OH)2D3 decreases the percentage of proliferating CD4+ cells within the eldest generations. PBMC were cultured with no stimulation (A to C) or with M. bovis PPD (5 μg/ml) (D to F). In addition, cultures received either 0 (A and D), 1 (B and E), or 10 (C and F) nM 1,25(OH)2D3. After a 6-day incubation, cells were harvested, stained with either CACT138A, anti-CD4; CACT80C, anti-CD8α; or BAQ4A, anti-WC1 and analyzed by flow cytometry for PKH67 intensity and cell surface marker expression. After flow cytometric analysis, data were analyzed by using the Modfit Proliferation Wizard to determine the number of cells that had proliferated (grey peaks). A representative response from a single M. bovis-infected animal is depicted. Gates for this particular sample were set on live (e.g., based upon light scatter properties) and CD4+ cells. Black peaks depict the parent generations (e.g., PKH67 bright), whereas daughter generations are depicted with peaks in various shades of grey.

